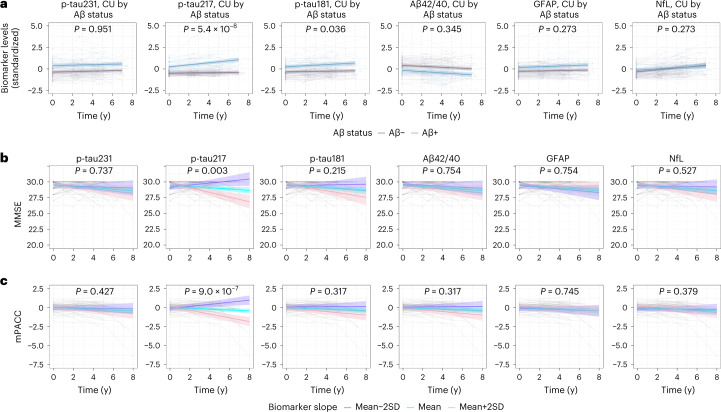
Fig. 4. Longitudinal plasma biomarker changes and their association with cognitive decline in WRAP (cohort 3).
a, Longitudinal plasma biomarker change stratified by Aβ status (negative, purple; positive, blue) in CU participants. The average regression lines with 95% CI (shaded area) were plotted from linear mixed effects models with the interaction between time and Aβ status as well as baseline Aβ status independent variables and adjusting for age and sex. All p-tau biomarkers, Aβ42/40 (P < 0.001) and GFAP (P = 0.005) were significantly changed in Aβ+ individuals at baseline. Several outliers (p-tau217, n = 5; p-tau181, n = 2; GFAP, n = 1; NfL, n = 3) are not shown in (a) but these data were included in the statistical analysis. b,c, The association between longitudinal plasma biomarkers and MMSE (b) and mPACC (c) in Aβ-positive cognitively unimpaired participants. The model trajectories, shown as the mean slope and the mean ± 2 SD with 95% CI (shaded area), were plotted from linear mixed effects models with the interaction between time and standardized plasma biomarker slopes (derived from subject-level linear regression models) as an independent variable adjusting for age, sex and years of education. Two-sided P values were corrected for multiple comparisons using Benjamini–Hochberg FDR; corrected and uncorrected P values are shown in Tables 1 and 2 and Supplementary Tables 1 and 2. One outlier with MMSE value of 17 is not shown in b but was included in the statistical analysis The x axes in a–c show time from first plasma biomarker samples.

