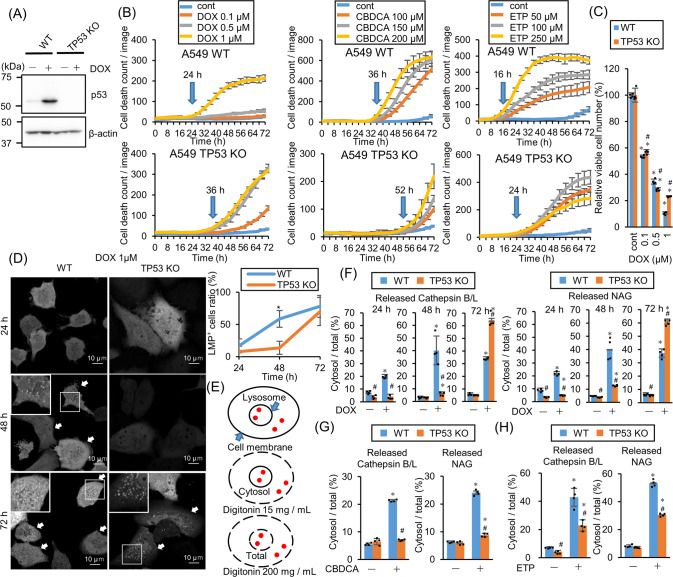
Fig. 1. TP53-knockout (KO) retards lysosomal membrane permeabilization (LMP)-mediated cell death in response to DNA-damaging drugs.
A TP53-KO in A549 cells was confirmed by western blotting. p53 expression was assessed after 1 µM doxorubicin (DOX) treatment for 24 h. β-actin was used as a control. B Wild-type (WT) and TP53-KO A549 cells were treated with DOX, etoposide (ETP), or carboplatin (CBDCA) and dead cell count was monitored every 4 h by a live-cell imaging system with propidium iodide (PI) staining. The cell death initiation point after 1 µM DOX treatment is indicated using blue arrows. The cell death initiation point was defined as follows: the highest and lowest dead cell count under drug treatment was defined as 100 and 0, respectively. Cell death onset was defined as the point where the difference between the control and drug-treated dead cell counts was >6. C The viable WT and TP53-KO A549 cell count 48 h after DOX treatment. n = 4, bar = mean ± SD, *p < 0.05 vs. cont., #p < 0.05 vs. WT. D Aequorea coerulescens green fluorescence protein-conjugated galectin-3 (AcGFP–Gal3)-expressing WT or TP53-KO A549 cells were treated with 1 µM DOX for 24, 48, or 72 h. AcGFP–Gal3 puncta were observed using confocal microscopy and the LMP+ cell ratio was calculated and summarized in right. Arrows indicate LMP+ cells. Scale bar = 10 µm. n = 10, bar = mean ± SD, *p < 0.05 vs. TP53-KO. E A schema of LMP enzymatic assay. The plasma membrane and lysosomal membrane are shown in black. Lysosomal enzymes are shown in red dots. Membranes permeabilized using different digitonin concentrations are shown with a dashed line. The LMP degree was measured by assessing the leaked cytosolic (15 mg/mL digitonin) and whole-cell (200 mg/mL digitonin) lysosomal enzymatic activity. F LMP in WT and TP53-KO A549 cells treated with 1 µM DOX for 24, 48, and 72 h were measured by assessing released cytosolic N-acetyl-glucosaminidase (NAG) or cathepsin B/L activity. n = 4, bar = mean ± SD, *p < 0.05 vs. cont., #p < 0.05 vs. WT. G,H LMP in WT and TP53-KO A549 cells treated with (G) 150 µM CBDCA for 66 h or (H) 250 µM ETP for 29 h were measured. n = 4, bar = mean ± SD, *p < 0.05 vs. cont., #p < 0.05 vs. WT.

