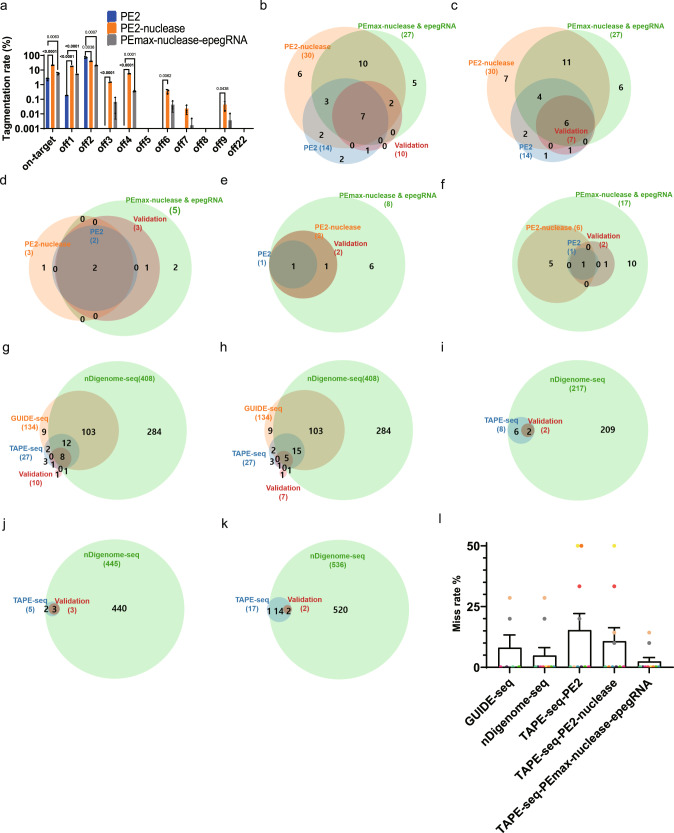
Fig. 4. TAPE-seq analysis using PE2-nuclease and PEmax-nuclease with engineered pegRNAs.
a Tagmentation rates at the HEK4 on-target site and various associated off-target sites after TAPE-seq using PE2, PE2-nuclease, or PEmax-nuclease with epegRNAs was performed; two-sided unpaired student t test. (n = 3 independent transfection). b–f Venn diagrams showing the number of and overlap between off-target loci predicted by TAPE-seq using PE2, PE2-nuclease, or PEmax-nuclease with epegRNAs, and validated off-target sites for the b HEK4 (+2 G to T), c HEK4 (+3 TAA ins), d HBB (+4 A to T), e DNMT1 (+6 G to C), and f VEGFA (+5 G to T) pegRNAs. g–k Venn diagrams showing the number of and overlap between off-target loci predicted by TAPE-seq using PEmax-nuclease with epegRNAs, GUIDE-seq, and nDigenome-seq and validated off-target sites for the g HEK4 (+2 G to T), h HEK4 (+3 TAA ins), i HBB (+4 A to T), j DNMT1 (+6 G to C), and k VEGFA (+5 G to T) pegRNAs. l Miss rates of the five different off-target prediction methods (n = 6 independent experiments for GUIDE-seq and n = 10 independent experiments for the rest of the methods each represented by different color). The bars represent the mean. Error bars indicate standard deviation.

