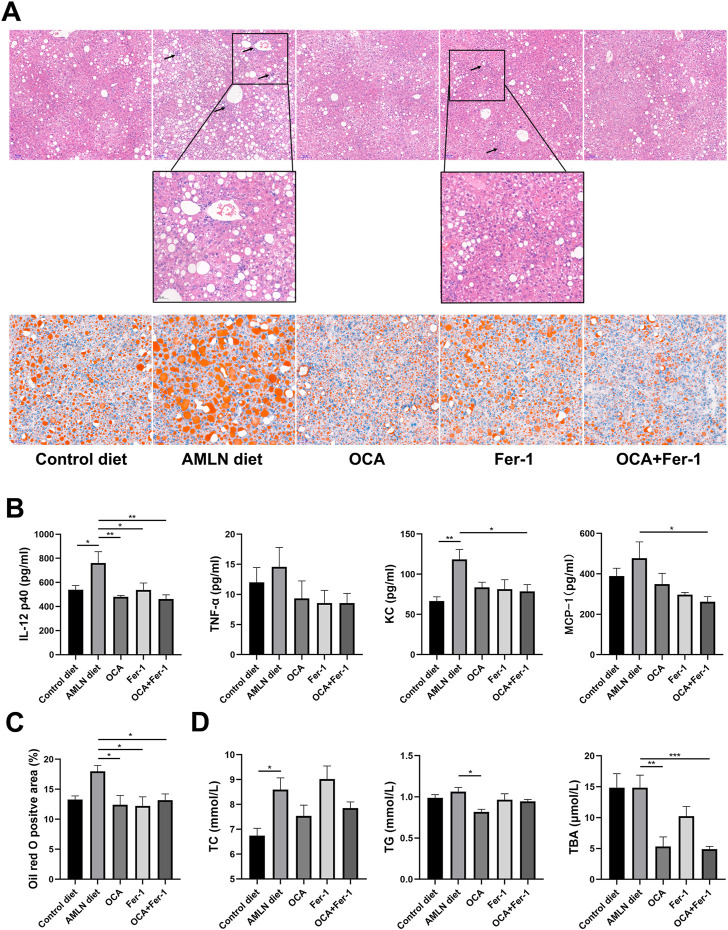
FIGURE 2.
Combination of OCA and Fer-1 significantly reduced lipid accumulation and inflammation. (A) Representative H&E (upper, scale bar: 100 μm) and Oil red O (lower, upper, scale bar: 50 μm) staining of liver tissues, the neutrophil infiltration area was enlarged and pointed out with black arrows (scale bar: 50 μm). (B) Serum cytokine levels of IL-12 p40, TNF-α, KC and MCP-1. (C) The positive area of Oil red O staining. (D) Serum levels of TC, TG and TBA. Data are shown as mean ± SEM. *p < 0.05, **p < 0.01, ***p < 0.001.

