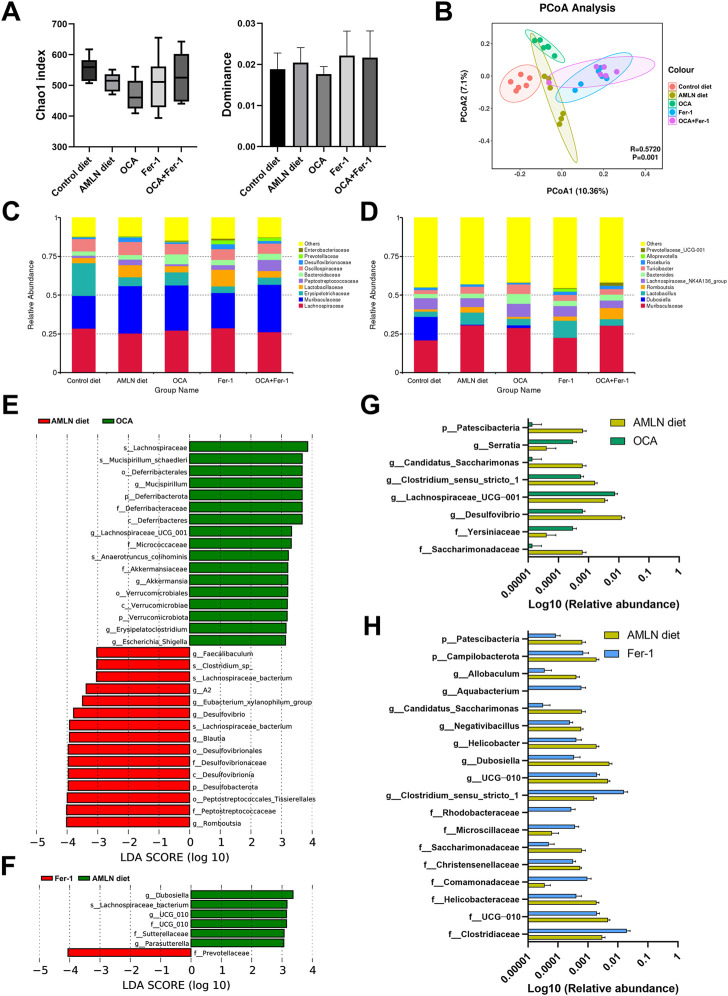
FIGURE 5.
OCA and Fer-1 differentially reshaped intestinal microbiome. (A) alpha diversity indexes (Chao1 and dominance) of five groups. (B) Principal coordinates analysis (PCoA) based on weighted UniFrac distances. (C) Relative abundance of altered taxa at the family (F) and genus (G) levels. (E–F) LEfSe cladogram represents the taxa enriched in the groups. (G) Taxa with significant differences between the AMLN diet group with OCA group. (H) Taxa with significant differences between the AMLN diet group with Fer-1 group. Data are shown as mean ± SEM (D).

