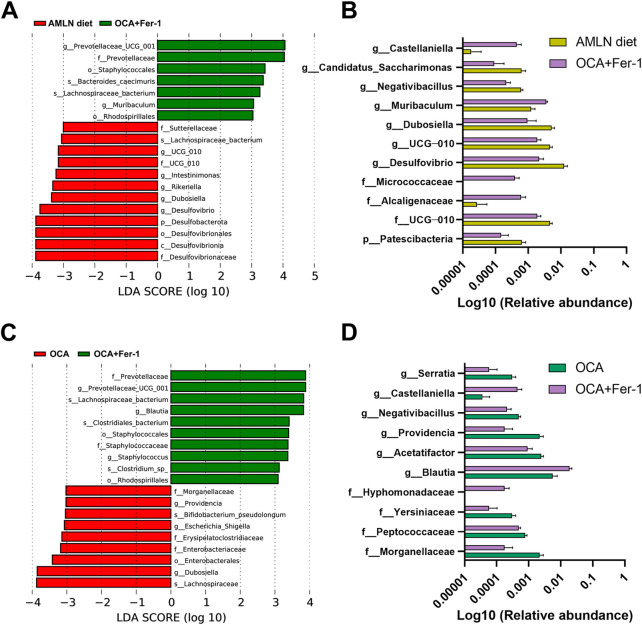
FIGURE 6.
The combination of OCA and Fer-1 differentially reshaped intestinal microbiome. (A) LEfSe cladogram represents the taxa enriched in the AMLN diet group and the OCA + Fer-1 group. (B) Taxa with significant differences between the AMLN diet group and the OCA + Fer-1 group. (C) LEfSe cladogram represents the taxa enriched in the OCA group and the OCA + Fer-1 group. (D) Taxa with significant differences between the OCA group and the OCA + Fer-1 group. Data are shown as mean ± SEM.

