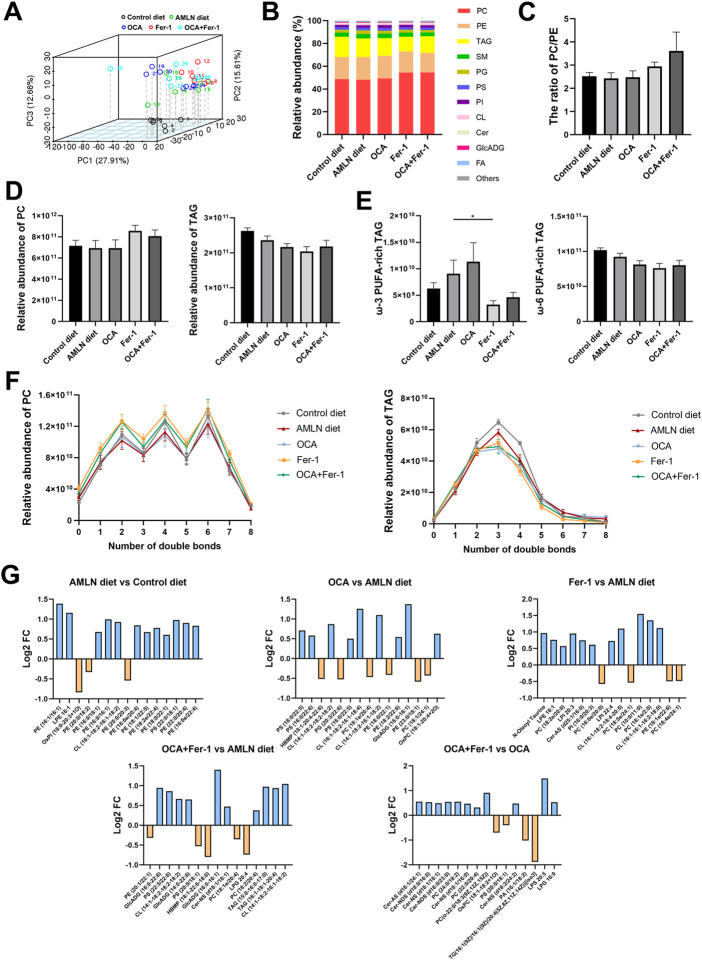
FIGURE 7.
OCA and Fer-1 differentially modulated hepatic lipidome. (A) Principal Component Analysis between the five groups. (B) Relative abundance (%) of lipid subclass among five groups (C) The ratio of PC/PE. (D) Relative abundance of PC (left) and TAG (right). (E) Relative abundance of ω-3 PUFA -rich TAG (left) and ω-6 PUFA -rich TAG (right). (F) Relative abundance of PC (left) and TAG (right) with different amount of double bonds. (G) The top 15 most significant lipids between groups. Data are shown as mean ± SEM. *p < 0.05.

