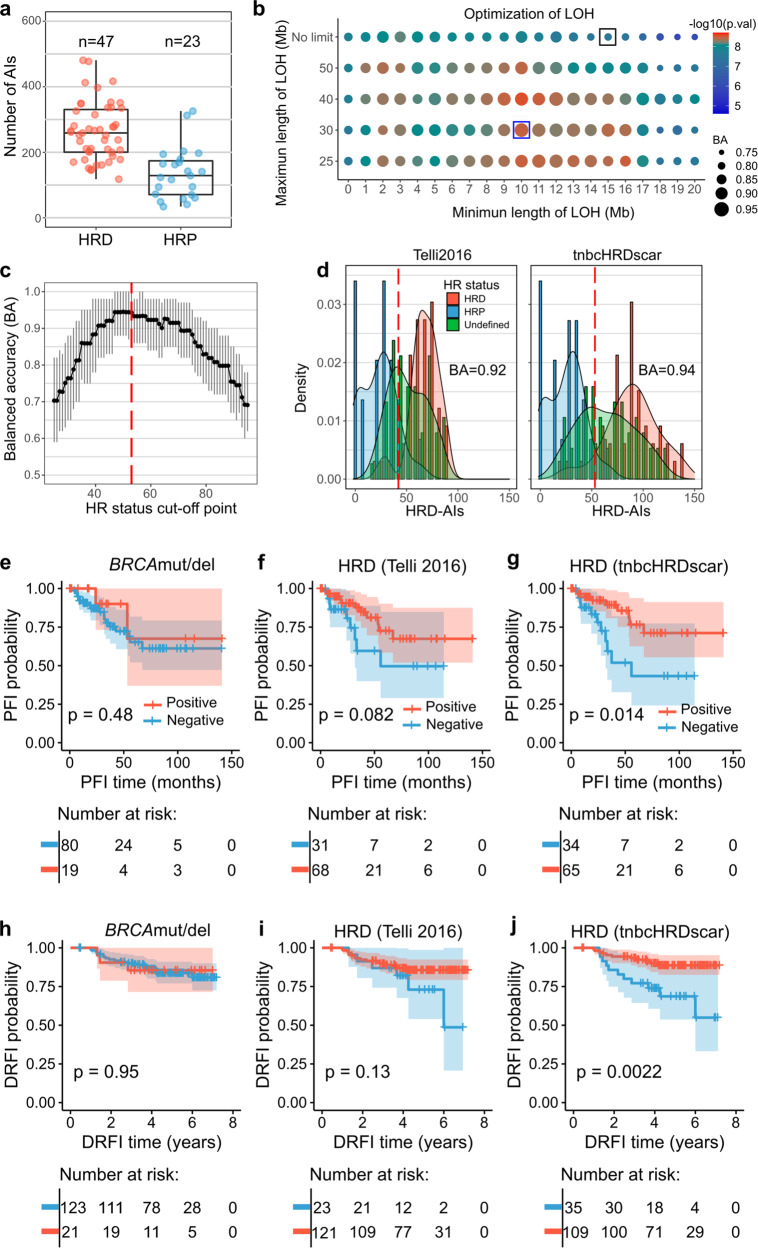
Fig. 5. Machine learning-aided detection of HRD-AI in TNBC improves the prediction of clinical outcomes.
a Number of AIs for TNBC in HRD and HRP samples in the TCGA. Corresponding box plots are shown, the black horizontal lines represent the sample medians, the boxes extend from first to third quartile and whiskers indicate the values at 1.5 times the interquartile range. b Detection of LOH events. The size of the dots represents the decision tree balanced accuracy (BA) of classifying HRD and HRP using LOHs of the corresponding length, and the dot colors represent the difference in abundance of LOH between HRD versus HRP samples (U test, p-value). Black box corresponds to the selection criteria utilized in the Telli2016 algorithm, and the blue box corresponds to the tnbcHRDscar BA and U test value. c Evaluation of the cut-off for tnbcHRDscar to define HR-status. The black dots connected with a line represent the balanced accuracy (BA) of the classification of the HRD and HRP samples using the given cut-off value, the 95% confidence intervals are shown in gray, the value of 53 (red dashed line) shows the highest BA. d Density distribution of HRD-AIs according to the Telli2016 and tnbcHRDscar algorithms. The red dashed line represents the cut-off established to define HR-status using Telli2016 (≥ 42) and tnbcHRDscar (≥53). The balanced accuracy (BA) for classifying the HR-status is shown for Telli2016 and ovaHRDscar algorithm. e–g Kaplan–Meier plots of PFS (Log-rank test) in TNBC patients in the TCGA stratified using: the BRCAmut/del status (e), the Telli2016 algorithm (f), the tnbcHRDscar (g). h–j Kaplan–Meier plots of distant relapse-free interval (DRFI, Log-rank test) of the TNBC patients in the validation dataset stratified using: the BRCAmut/del status (h), the Telli2016 algorithm (i), the tnbcHRDscar algorithm (j).

