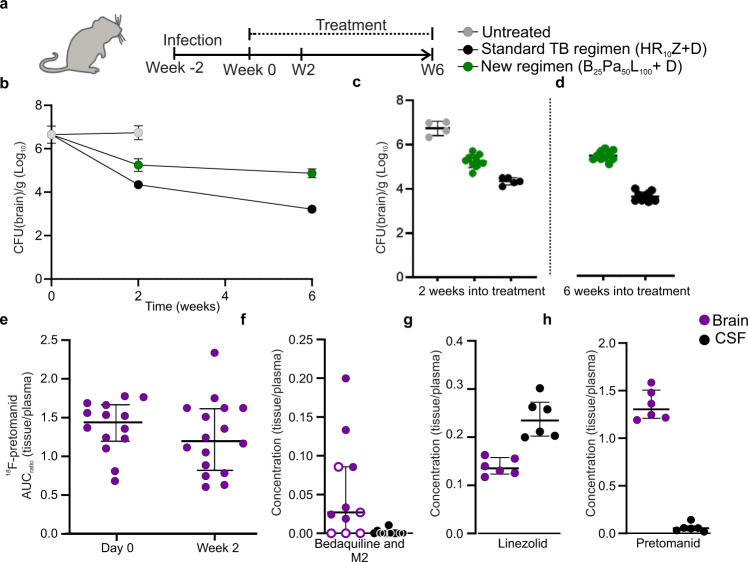
Fig. 4. Evaluation of BPaL regimen in the mouse model of TB meningitis.
a After two weeks of infection incubation (week 0), mice were randomly allocated into treatment groups; standard TB regimen (rifampin [R], isoniazid [H] and pyrazinamide [Z]), and a new regimen (BPaL; bedaquiline [B], pretomanid [P] and linezolid [L]). Rifampin (10 mg/kg/day), isoniazid (10 mg/kg/day), pyrazinamide (150 mg/kg/day), pretomanid (50 mg/kg/day divided twice daily), bedaquiline (25 mg/kg/day), and linezolid (100 mg/kg/day divided twice daily) were administered via oral gavage. Mouse dosing was utilized to match the standard human equipotent dosing: rifampin (10 mg/kg/day), isoniazid (10 mg/kg/day), pyrazinamide (25 mg/kg/day), pretomanid (200 mg/day), bedaquiline (standard oral dosing), and linezolid (1200 mg/day). All regimens received adjunctive dexamethasone via intraperitoneal injection. Four mice remained untreated for two weeks. b Bacterial burden over the treatment duration and (c) after two (P = 0.001) and (d) six weeks (P < 0.001) of treatment (animal numbers at two weeks, n = 4/untreated, 5/standard TB regimen, and 10/BPaL; at six weeks n = 10/each group). e 18F-Pretomanid AUC ratios (brain/plasma) in mice with TB meningitis (P = 0.294). PET studies are based on microdoses (ng-µg) administered intravenously. Mass spectrometry-derived brain/plasma (purple dot) or CSF/plasma (black dot) concentration ratios for (f) bedaquiline [and M2 metabolite (open dot)] (P = 0.002), (g) linezolid (P = 0.002) and (h) pretomanid (P = 0.002) (n = 6/group) in mice with TB meningitis, following a single-dose and measured at Tmax. CFU data is represented as mean ± SD on a logarithmic scale. PET and mass spectrometry data are represented as median ± IQR. Statistical comparisons were made using two-tailed Mann–Whitney-Wilcoxon test or a two-way ANOVA followed by Bonferroni’s test. Source data are provided as a Source Data file.

