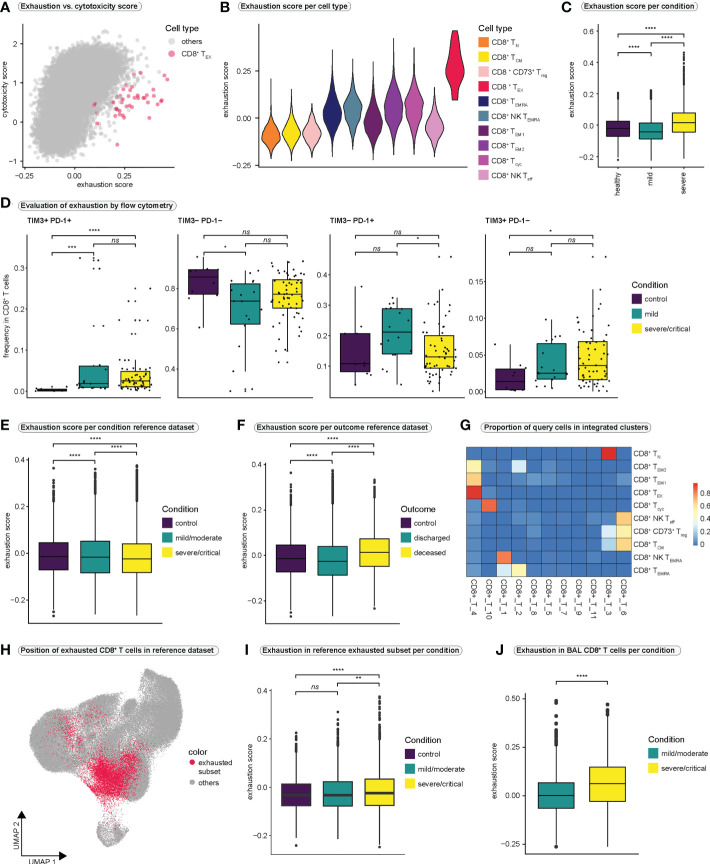
Figure 2.
CD8+ T cell exhaustion in COVID-19 (A) Relationship between T cell exhaustion and cytotoxicity. Each CD8+ T cell is placed in the coordinate system according to its individual exhaustion and cytotoxicity score value. To highlight the position of CD8+ exhausted T cells, all other CD8+ T cell populations are colored in gray. A version of this plot with cell type-specific and condition-specific colors is available in Figure S2A, S2B , respectively. (B) Violin plot of exhaustion scores per cell type. (C) Exhaustion scores in all CD8+ T cells per condition. (Kruskal-Wallis test: H (2) = 2407, p < 0.0001; healthy vs. mild: p < 0.0001; healthy vs. severe: p < 0.0001, mild vs. severe: p < 0.0001) (D) Frequencies of cells expressing different combinations of the exhaustion markers PD-1 and TIM3 in all CD8+ T cells as examined by flow cytometry. (TIM3+PD-1+: Kruskal-Wallis test: H(2) = 21.59, p < 0.0001; control vs. mild: p = 0.0002; control vs. severe/critical: p < 0.0001, mild vs. severe/critical: p = 0.8933; TIM3-PD-1-: Kruskal-Wallis test: H(2) = 6.314, p = 0.0426; control vs. mild: p = 0.036; control vs. severe/critical: p = 0.1046, mild vs. severe/critical: p = 0.1689; TIM3-PD-1+: Kruskal-Wallis test: H(2) = 6.07, p = 0.0481; control vs. mild: p = 0.1303; control vs. severe/critical: p = 0.9359, mild vs. severe/critical: p = 0.0484, TIM3+PD-1-: Kruskal-Wallis test: H(2) = 6.287, p = 0.0431; control vs. mild: p = 0.1369; control vs. severe/critical: p = 0.0377, mild vs. severe/critical: p = 0.4863) (E) Exhaustion score in all CD8+ T cells in the reference dataset per condition. (Kruskal-Wallis test: H(2) = 149.7, p < 0.0001; control vs. mild: p < 0.0001; control vs. severe/critical: p < 0.0001, mild vs. severe/critical: p < 0.0001) (F) Exhaustion score in all CD8+ T cells in the reference dataset per outcome. (Kruskal-Wallis test: H(2) = 1328, p < 0.0001; control vs. discharged: p < 0.0001; control vs. deceased: p < 0.0001, discharged vs. deceased: p < 0.0001) (G) Heatmap displaying the proportions of query cell types that mapped to each cluster in the integrated dataset. High values indicate that most cells of a query cluster were assigned to a distinct cluster in the reference dataset. (H) Projection of cells that mapped to exhausted CD8+ T cells from the query dataset onto the UMAP of the reference dataset. (I) Exhaustion scores per condition in cells from the reference dataset that mapped to exhausted CD8+ T cells in the query dataset. (Kruskal-Wallis test: H(2) = 31.24, p < 0.0001; control vs. mild/moderate: p = 0.1054; control vs. severe/critical: p < 0.0001, mild/moderate vs. severe/critical: p = 0.0011) (J) Exhaustion scores per condition in CD8+ T cells from bronchoalveolar lavage fluid. (Kolmogorov-Smirnov test: D = 0.2422, p < 0.0001) BAL, bronchoalveolar lavage. **** = p-value ± 0.0001, *** = p-value ± 0.001, ** = p-value ± 0.01, * = p-value < 0.05, ns = not significant.

