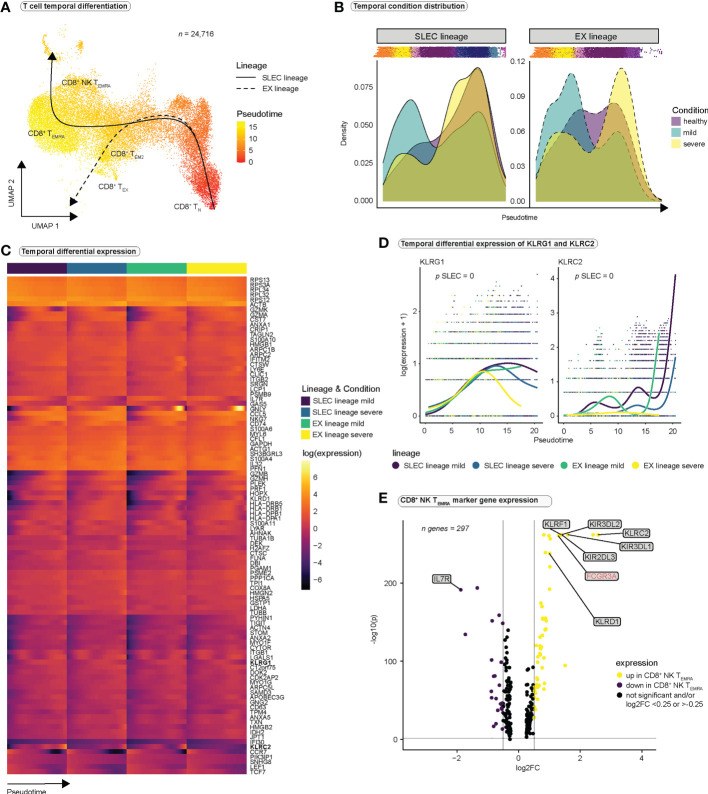
Figure 3.
CD8+ T cells differentiate towards an NK-like phenotype during SARS-CoV-2 infection. (A) Pseudotimes and estimated trajectories projected onto the integrated UMAP of cell types likely originating in naïve CD8+ T cells (n = 24,716). For trajectory inference with Slingshot, naïve CD8+ T cells were manually chosen as the origin of differentiation. (B) Temporal distribution of cell densities for all three conditions across pseudotime. Shifts in distribution between the mild and the severe condition for the short-lived effector cells (SLEC) and exhaustion (EX) lineage were tested with the Kolmogorov-Smirnov method (EX: D = 0.40237, p < 2.2e-16, SLEC: D = 0.31004, p < 2.2e-16). (C) Heatmap depicts differentially expressed genes between the progenitor and differentiated cell populations across pseudotime (start vs. end testing). (D) Smoothed expression of KLRG1 and KLRC2 across pseudotime with the y-axis on natural logarithmic scale. p-values report the result of differential expression analysis between progenitor and differentiated cell states across pseudotime (start vs. end testing). An extended panel of genes and their UMAP projections are reported in Figure S4 . (E) Volcano plot of genes differentially expressed in CD8+ NK-like TEMRA cells.

