Figure 4.
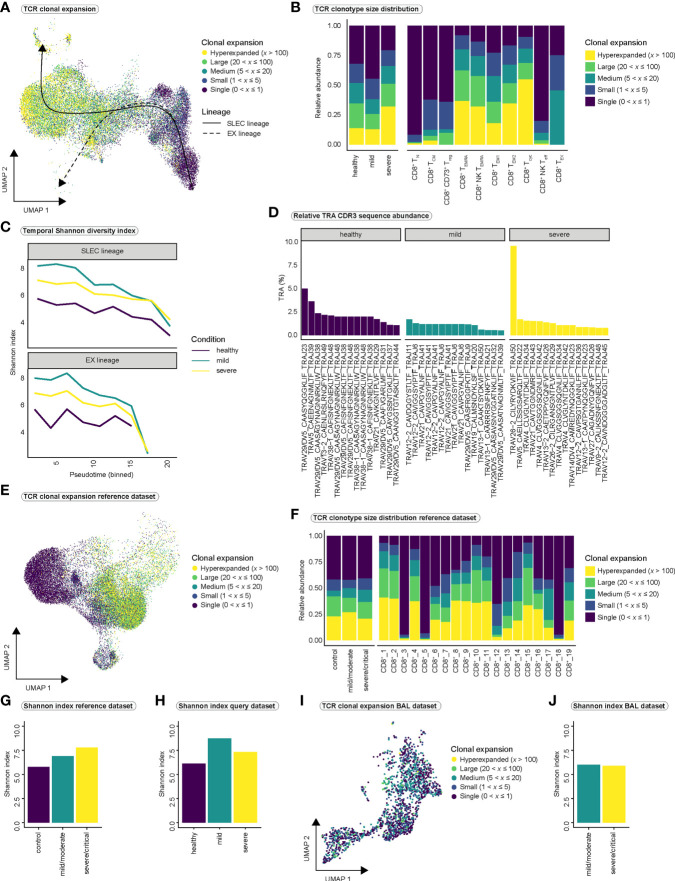
Clonal expansion and TCR diversity in COVID-19. (A) T cell receptor clonal expansion projected onto the integrated UMAP of cell types. (B) Distribution of clonal expansion within the conditions (left) and within the CD8+ T cell populations (right), displayed as relative abundance of clonotype expansion groupings ( Figure S5A is referred to for abundance per cell type within each condition). (C) Shannon diversity index as a measure of clonal diversity across pseudotime for the three conditions among SLEC and EX lineages. Shannon index was calculated on the whole TCR sequences, including TRA and TRB chains. (D) Relative proportion of CDR3 sequences of the 15 most abundant clones to the total number of CDR3 sequences per condition for the TRA chain ( Figure S5C is referred to for the relative proportion of CDR3 sequences for the TRB chain). (E) TCR clonal expansion projected onto the UMAP of the PBMC-derived CD8+ reference dataset. (F) Distribution of clonal expansion within the conditions (left) and within the CD8+ T cell populations (right), displayed as relative abundance of clonotype expansion groupings for the PBMC-derived reference dataset. ( Figure S5D is referred to for abundance per cell type within each condition of the reference dataset). (G) Shannon diversity index per condition for the PBMC-derived reference dataset and (H) for our query dataset. (I) TCR clonal expansion projected onto the UMAP of the BAL-derived CD8+ reference dataset. (J) Shannon diversity index per condition for the BAL-derived reference dataset. TCR, T cell receptor; SLEC, short-lived effector cell; EX, exhaustion; TRA, T cell receptor alpha chain; TRB, T cell receptor beta chain; CDR3, Complementarity determining region 3; BAL, bronchoalveolar lavage.

