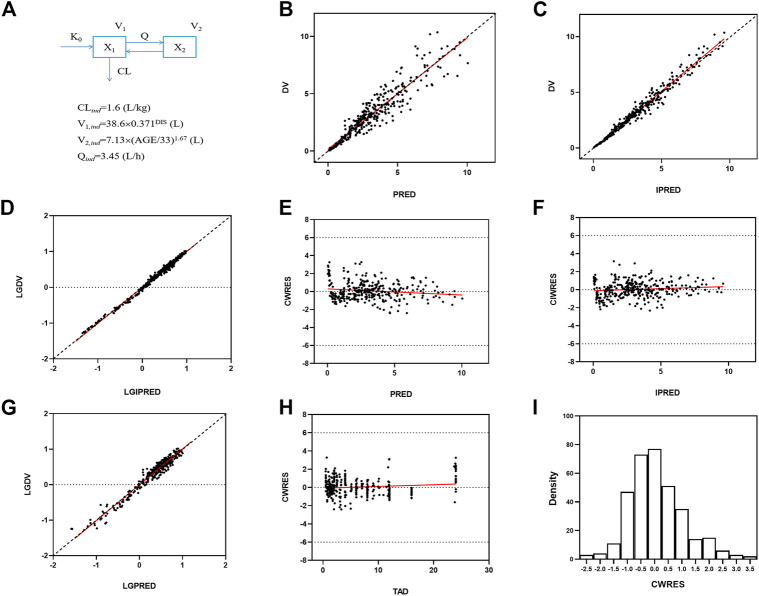
FIGURE 2.
Goodness-of-fit plots for the final population PK model. Predicted concentrations are in micrograms per liter and time is in hours. (A) PPK model schematic figure and final model, DIS = 1 for patients and DIS = 2 for healthy subjects; (B) Observed polymyxin B concentrations (DV) versus population predictions (PRED). (C) DV versus individual predictions (IPRED). (D) Log transformed DV versus Log transformed IPRED. (E) Conditional weighted residuals (CWRES) versus PRED. (F) Conditional individual weighted residuals (CIWRES) versus IPRED. (G) Log transformed DV versus Log transformed PRED. (H) CWRES versus time after dose (TAD). (I) distribution of CWRES.

