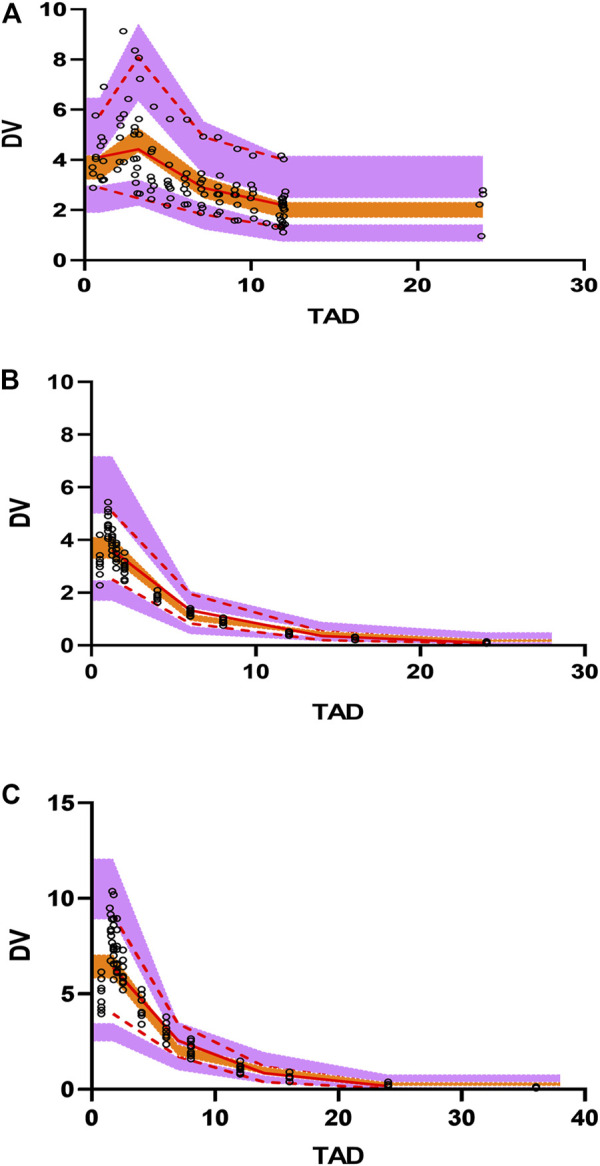
FIGURE 3.

Visual predictive check (VPC) plots for the polymyxin B concentration in plasma. (A) VPC for BSI patients. (B) VPC for healthy subjects with .75 mg/kg dosing administration. (C) VPC for healthy subjects with 1.5 mg/kg dosing administration. Open circles represent observed concentrations. The solid red line represents the median of the observations. The red dashed lines represent the 5th and 95th percentiles of the observations. The purple shaded areas represent the 95% confidence intervals for the 5th and 95th percentiles, and the orange shaded areas represents the median of the predicted data.
