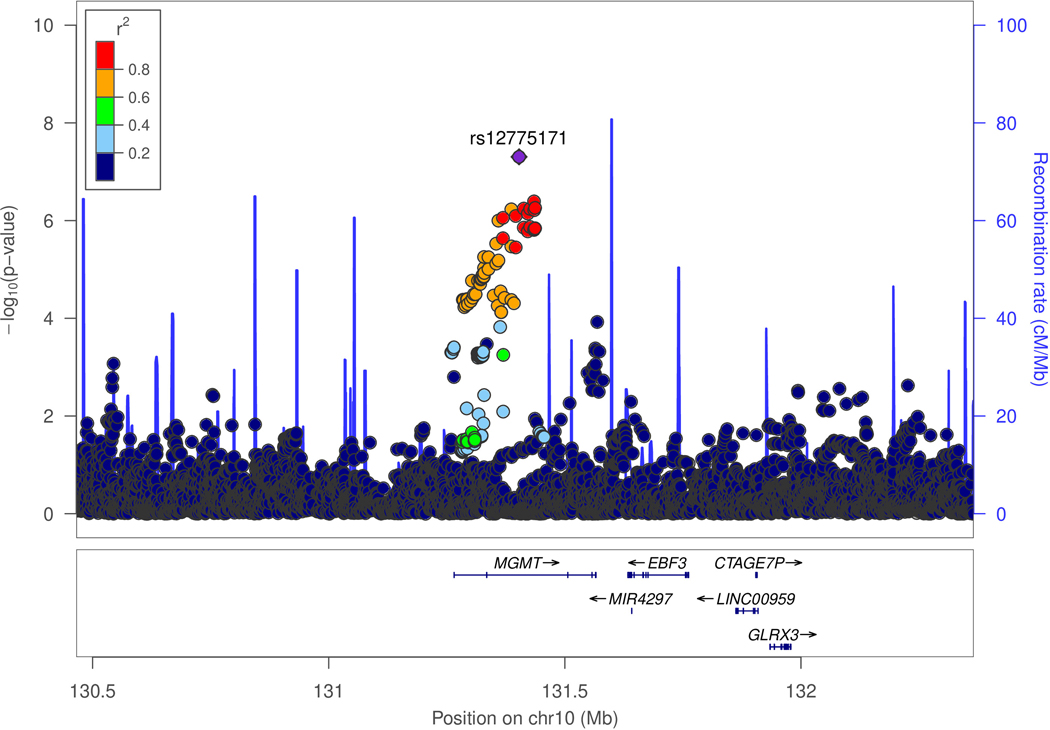
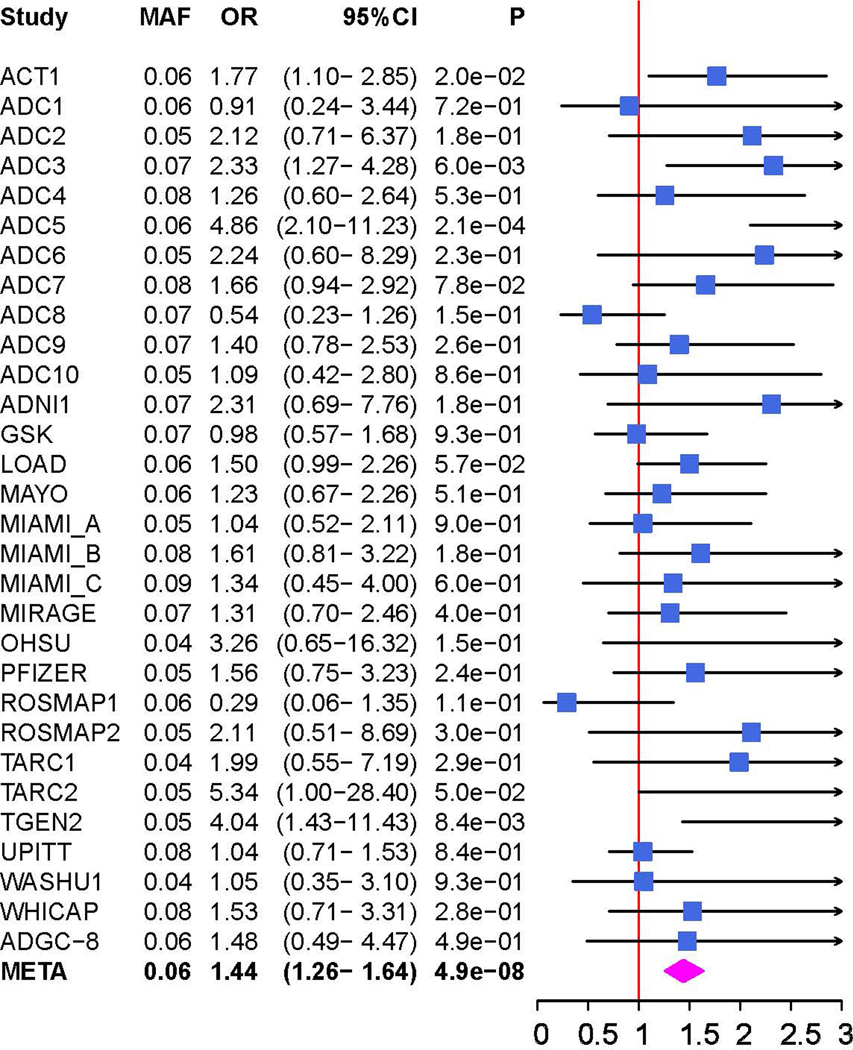
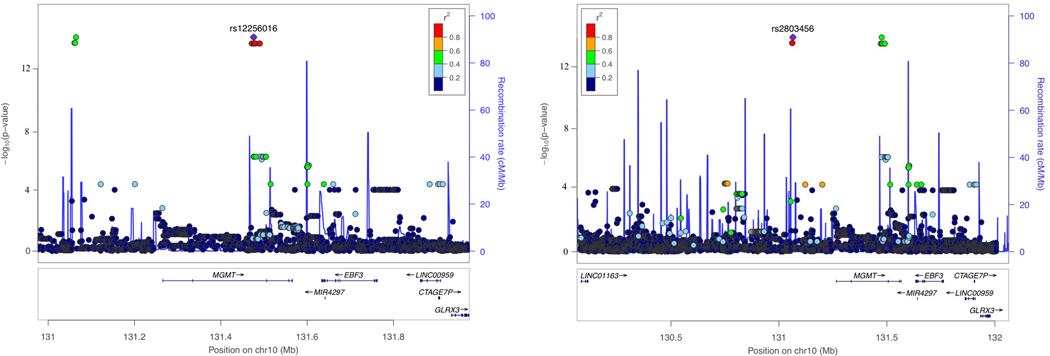
Figure 2.
Genetic association of Alzheimer disease (AD) with MGMT in the ADGC datasets (A and B) and in the Hutterites (C). A. Locus-zoom plot showing the association of AD with SNPs in the MGMT region in the ADGC datasets. The SNP with the lowest P-value (rs12775171) is indicated with a purple diamond. Computed estimates of linkage disequilibrium (r2) of SNPs in this region with rs1277517 are color-coded according to the key. B. Forest plot of the association of AD with rs12775171 among the APOE ε4- women within each ADGC dataset and in the toal sample (META). The ADGC-8 dataset includes eight individual GWAS datasets (ACT2, BIOCARD, CHAP2, EAS, NBB, RMAYO, UKS, and WASHU2) each containing < 50 subjects. The odds ratio (shaded symbol) and 95% confidence interval (represented by horizontal line) are plotted on the x-axis. C. Locus-zoom plot showing the association of AD with SNPs in the MGMT region in the Hutterites. Significance level is shown as the -log10(p-value). Computed estimates of linkage disequilibrium (r2) of SNPs in this region with the two most significant SNPs, rs12256016 (left panel) and rs2803456 (right panel), are color-coded according to the key. Recombination rates among adjacent SNPs are indicated with vertical blue lines.


