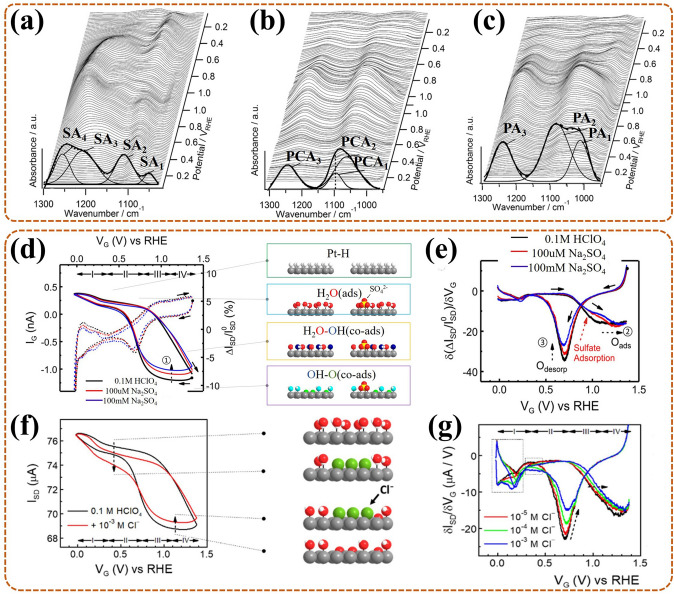
Fig. 13.
In-situ ATR-FTIR waterfall plots on Pt/C during ORR and with corresponding deconvolution by Gaussian fitting at 0.07 V, a in 0.5 M H2SO4 and for (bi)sulfate adsorption, b in 0.5 M HClO4 and for ClO4 adsorption, c in 0.5 M HClO4 + 10 mM H3PO4 and for relative adsorption [136]; Reused with approval; Copyright 2016 WILEY–VCH Verbg GmbH&Co. KGaA, Weinheim. d In-situ ETS curves (solid lines) and cyclic voltammetry curves (dash lines, without explain in this paper) of sulfate adsorptions on PtNW surface, with schematic of surface adsorption models in right side, with Pt (gray), H (white), O (red, in H2Oads; blue, in OHads), e dETS curves in 0.1 M HClO4 and 100 uM/100 Mm NaSO4; f In-situ ETS curves of chlorides adsorption, also with modes schematic in right side, with Pt (gray), H (white), O (red), Cl (green); g dETS curves with changing chloride concentrations; All dashed arrows for the influence of sulfates/chlorides adsorption on the varies of ETS or dETS [103]. Reused with approval; Copyright 2018 American Chemical Society. (Color figure online)

