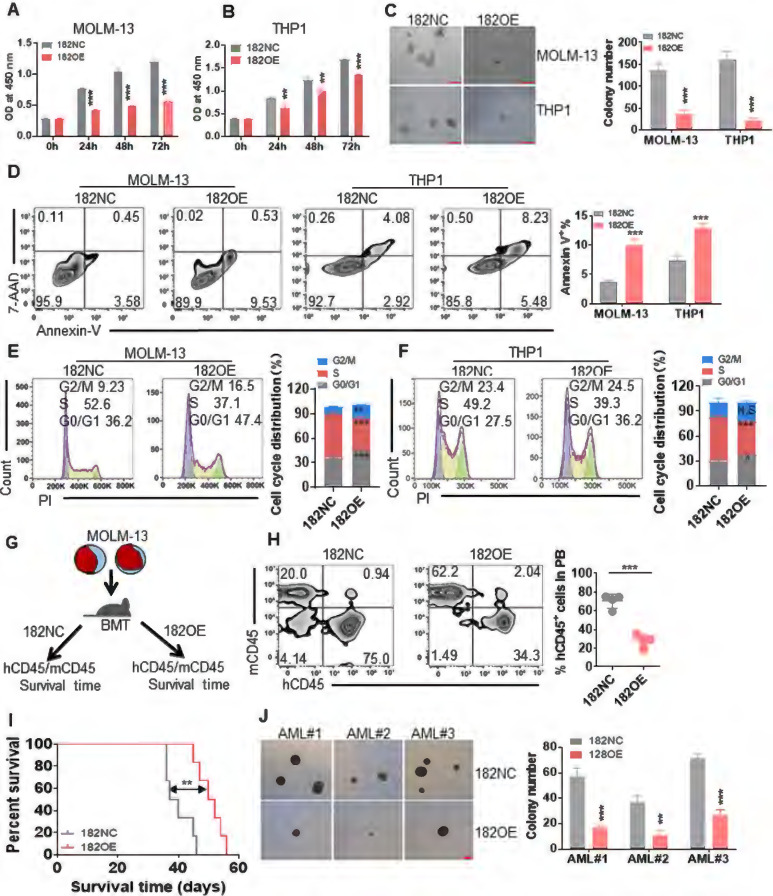
Figure 2.
Anti-leukemogenesis of miR-182 in human leukemic blasts in vitro and in vivo. MOLM-13 and THP1 cells were transduced with MSCV vector overexpressing miR-182 (182OE) or negative control MSCV-NC (182NC). (A and B) CCK8 was measured in different times in MOLM-13 and THP1 cells overexpressing miR-182 or NC. (C) MOLM-13 and THP1 cells overexpressing miR-182 or NC (2×10³/dish) were plated in methylcellulose medium for ten days to count colony number. Bar scales represent 200 μm. (D) Apoptosis was measured in MOLM-13 and THP1 cells overexpressing miR-182 or NC by Annexin V and 7-AAD staining. (E and F) Cell cycle distribution in MOLM-13 and THP1 cells, which were transduced with 182OE or 182NC. Shown are the representative plots (left) and statistical analysis of G2/M, S, and G0/G1 phase. (G) An illustration of the MOLM-13-transplanted NSG mice model. MOLM-13 cells were transduced with 182OE or 182NC and xenografted in NSG mice. The percentage of human CD45 (hCD45)/murine CD45 (mCD45) was measured as chimerism, and OS time was analyzed. (H) hCD45/mCD45 was measured in PB from MOLM-13-182OE and MOLM-13-182NC-xenografted NSG mice. Shown are the representative plots (left) and statistical analysis of the percentage of hCD45/hCD45+mCD45 cells (right). (I) OS was determined in MOLM-13-182OE or MOLM-13-182NC-xenografted NSG mice. (J) Colony numbers were counted in three CD34+ primary AML blasts transduced with 182OE or 182NC. AML blasts (1×10³/dish) were plated in methylcellulose medium for ten days to count colony numbers. Bar scales represent 200 μm. *P < 0.05; **P < 0.01; ***P < 0.001 versus 182NC. Using log-rank test for survival time.

