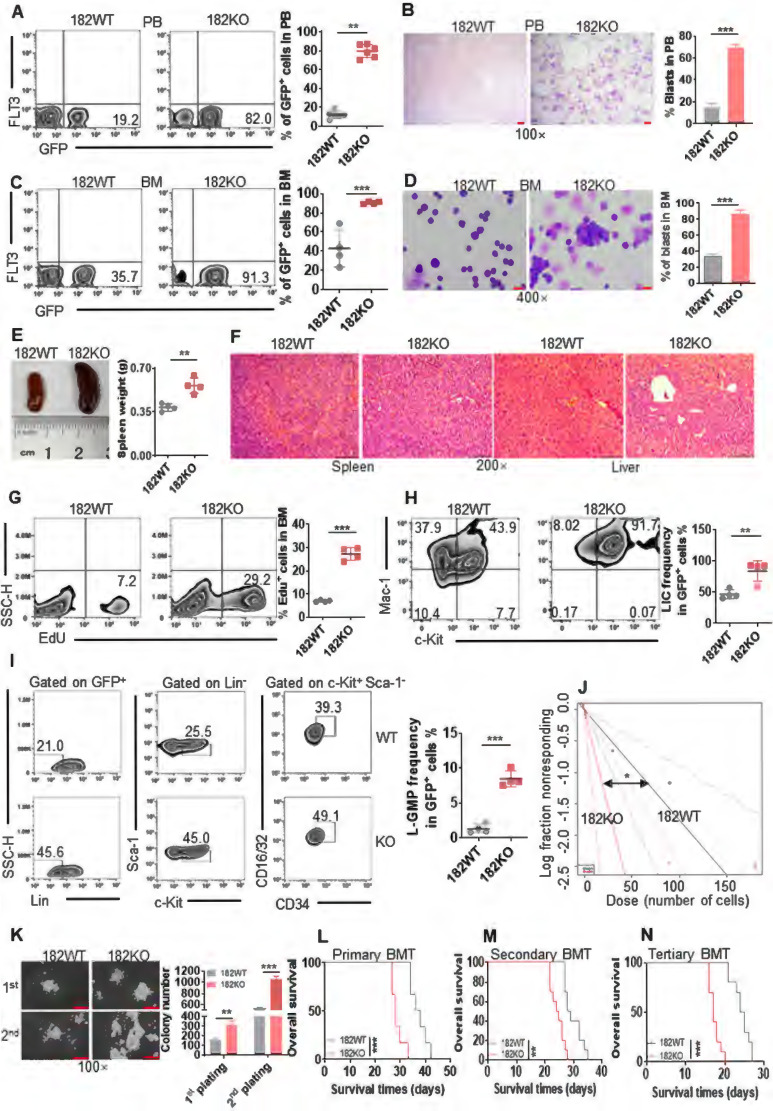
Figure 3.
Depletion of miR-182 (182KO) accelerates the development of MLL-AF9-transformed murine AML than wild-type control (182WT). (A and C) The percentages of GFP+ cells were measured in PB (A) and BM (C) in 182WT (n = 4) AML cells compared with 182KO (n = 4). Shown are the representative plots (left) and statistical analysis of GFP+ cells (right). (B and D) The representative images of PB (B) and BM (D) smears by Wright-Giemsa stain in 182WT compared with 182KO AML cells (left) and statistical analysis of leukemic blasts (right). Bar scales represent 10 μm for PB and 20 μm for BM. (E) The representative images of the spleen (left) and statistical analysis of spleen weight (right). n = 4 for 182WT and 182KO AML cells, respectively. (F) The representative images of HE stain of spleen and liver tissues. Bar scales represent 100 μm for spleen and liver tissues. (G) 182WT (n = 4) and 182KO (n = 4) AML blasts were incubated with EdU for 2 h in vitro, and EdU+ cells were measured in GFP+ cells by flow cytometry. Shown are the representative flow cytometry plots (left) and statistical analysis of EdU+ cells (right). (H) The frequencies of LIC (c-Kit+Mac-1+) were measured in BM 182WT (n = 4) and 182KO (n = 4) AML cells. Shown are the representative flow cytometry plots (left) and statistical analysis of LIC (right). (I) The frequencies of BM L-GMP (Lin-c-Kit+Sca-1-CD34+CD16/32+) were measured in BM 182WT (n = 4) and 182KO (n = 4) AML cells. Shown are the representative flow cytometry plots (left) and statistical analysis of L-GMP cells (right). (J) Limiting dilution assay of BM GFP+ cells from secondary BMT leukemic mice with 182WT (n = 6) and 182KO (n = 6). The frequency of LSC and P-value were counted by L-calc software. (K) GFP+ 182WT and 182KO murine AML blasts (2×10³/dish) were plated in methylcellulose medium for ten days for first and secondary plating. Shown are the representative pictures (left) and statistical analysis of colony (n = 3). Bar scales represent 20 μm. (L-N) Kaplan-Meier curves indicating the effects of miR-182 knockout on MLL-AF9-induced primary (L, n = 6), secondary (M, n = 10), and tertiary BMT (N, n = 10). *P < 0.05; **P < 0.01; ***P < 0.001. Using log-rank test for survival time.

