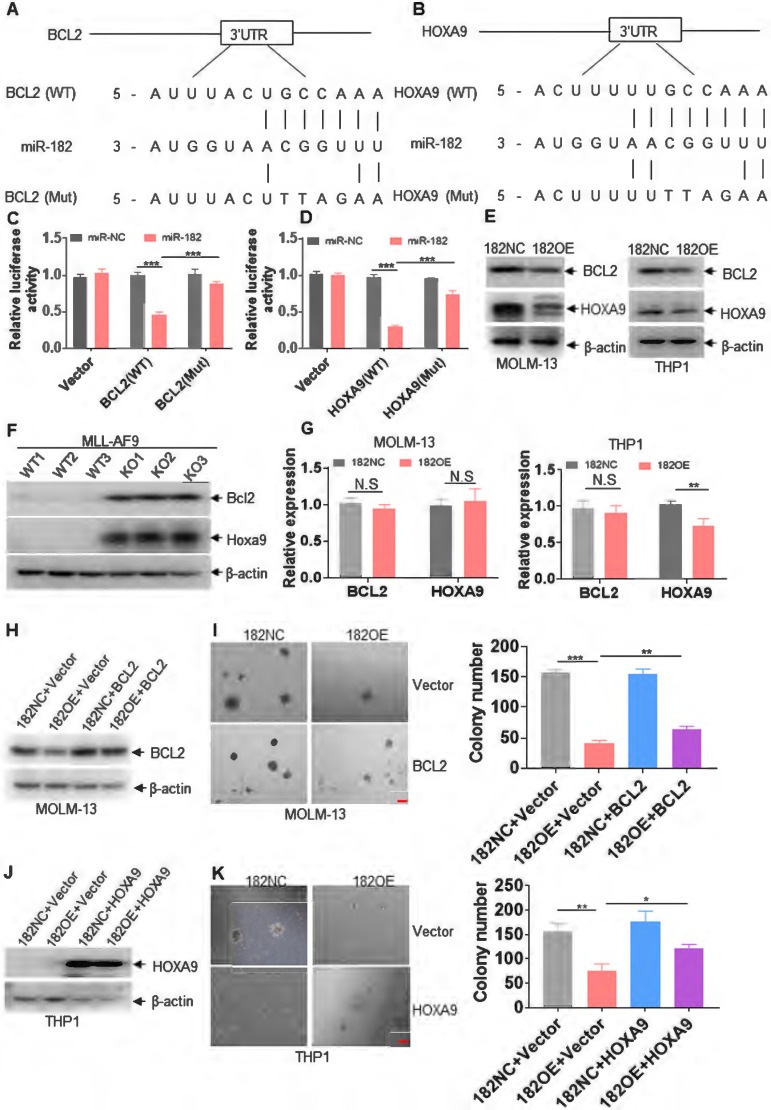
Figure 7.
miR-182 directly targets BCL2 and HOXA9. (A and B) Schematic of putative binding sites for miR-182 in 3'-UTR of BCL2 and HOXA9. (C and D) 293T cells were transfected with wild-type psicheck-2-BCL2-3'-UTR (WT), psicheck-2-BCL2-3'-UTR (Mut), psicheck-2-HOXA9-3'-UTR (WT), and psicheck-2-HOXA9-3'-UTR (Mut) for 24 h, following by the transfection with miR-182 mimic or scramble (miR-NC) for another 24 h. Firefly and Renilla luciferase activities were both measured. Histograms indicated that the Firefly luciferase activities were normalized to Renilla luciferase activities. (E) The protein expressions of BCL2 and HOXA9 were measured in MOLM-13 and THP1 cells transduced with 182OE or 182NC. (F) The protein levels of Bcl2 and Hoxa9 were measured in MLL-AF9-transformed murine AML blasts with 182WT or 182KO. (G) The transcript expressions of BCL2 and HOXA9 were measured in MOLM-13 and THP1 cells transduced with 182OE or 182NC. (H and J) The protein expressions of BCL2 and HOXA9 were determined in 182OE-and 182NC-transduced MOLM-13 and THP1 cells, following by transduction with LVX-HOXA9 or LVX-NC (Vector), respectively. (I and K) Colonies were counted in 182OE- and 182NC-transduced MOLM-13 and THP1 cells, which were transduced with LVX-HOXA9 or LVX-NC (Vector), respectively. Shown are the representative pictures (left) and statistical analysis of the colony (right). Bar scales represent 200 μm. *P < 0.05; **P < 0.01; ***P < 0.001. N.S: not significant.

