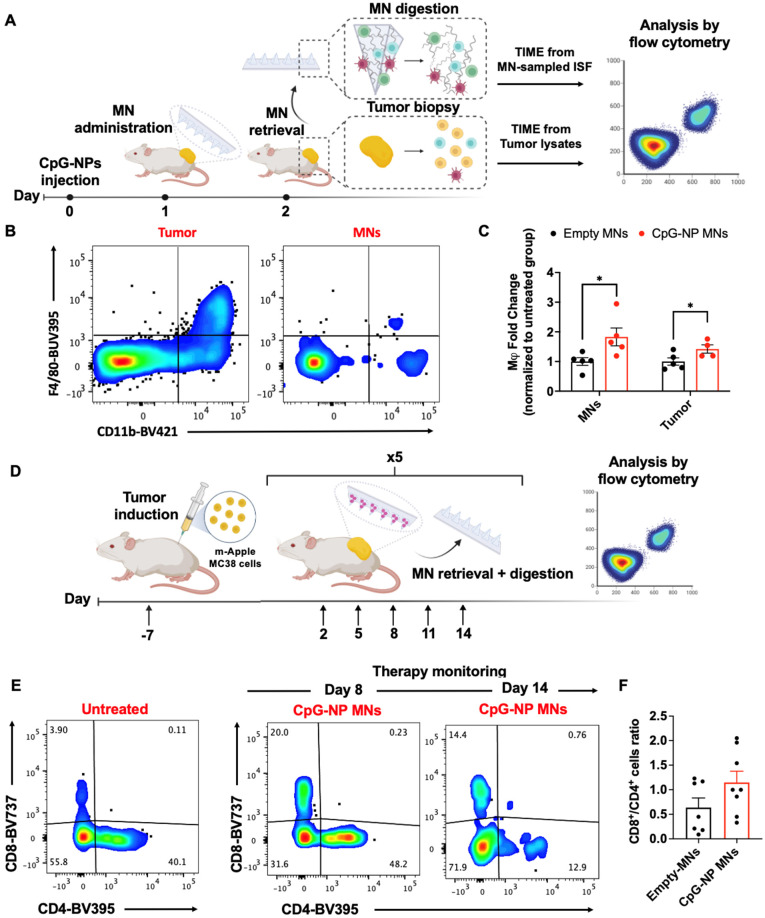
Figure 6.
Serial monitoring of the immune composition of the TME in ISF using HA-based MNs. A, Scheme of MN immune cell sampling. After a single-dose injection of CpG-NPs, MNs were administered and digested with TCEP upon retrieval for subsequent analysis of the cellular immune signature compared to that from tumor lysates by flow cytometry. B-C, Flow cytometry dot plot (left) and quantification of macrophages (CD11b+ F4/80+) (right) recovered with MNs at day 2 following treatment. Data are mean ± s.e.m. (n = 4-5). ***P < 0.001, **P < 0.01, *P < 0.05. D, Serial monitoring of T cell infiltrates in ISF following treatment with CpG-NP MNs. E, Representative dot plot of CD8+ and CD4+ T cell populations over time from MN-sampled ISF. F, Ratio of CD8+ to CD4+ T cells extracted with MNs representing pooled values from day 11 and day 14 post-treatment initiation. Data are mean ± s.e.m. (n = 7-8). ***P < 0.001, **P < 0.01, *P < 0.05.

