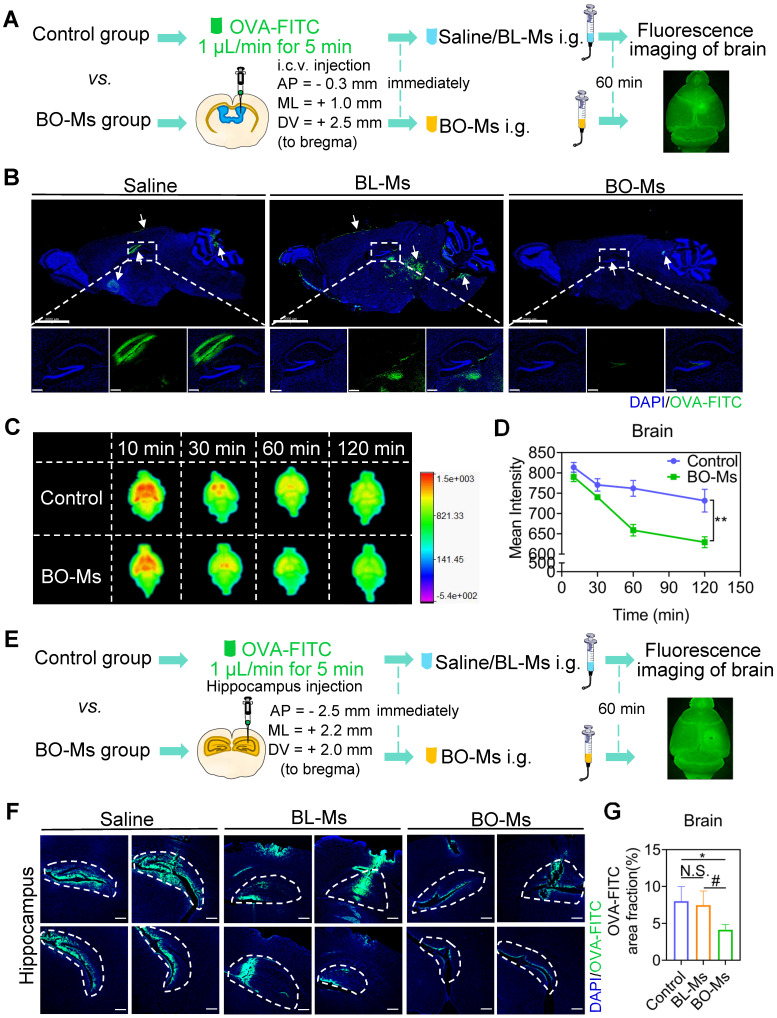
Figure 1.
BO-Ms improve the efflux of macromolecules from CNS. (A) Schematic of the experimental layout where mice were injected intracerebroventricular (i.c.v.) with OVA-FITC and then intragastrical administration (i.g.) of BO-Ms. (B) Representative brain sections stained with DAPI (blue) showing OVA-FITC (green) distribution in the brain parenchyma of the control group, BL-Ms group, and BO-Ms group at 1 h. (Scale bars, 2 mm. White arrow: OVA-FITC). (C) The Ex vivo fluorescence imaging and (D) The intensity of OVA-FITC in mice brain in both groups at 10, 30, 60, and 120 min. **p < 0.01 (Student's t-test), n = 3 mice per group, representative of two independent experiments. Data are means ± SEM. (E) Schematic of the experimental brain was imaging when mice were administered intragastrically by the garage of saline or BO-Ms after OVA-FITC injected hippocampus. (F) Representative brain sections showing OVA-FITC in green and cell nuclei in blue. (Scale bars, 2 mm). (G) The coverage rate of OVA-FITC (percentage of brain section). *p < 0.05, #p < 0.05, N.S. = not significant, (Student's t-test), n = 5 mice per group, representative of two independent experiments. Data are means ± SEM.

