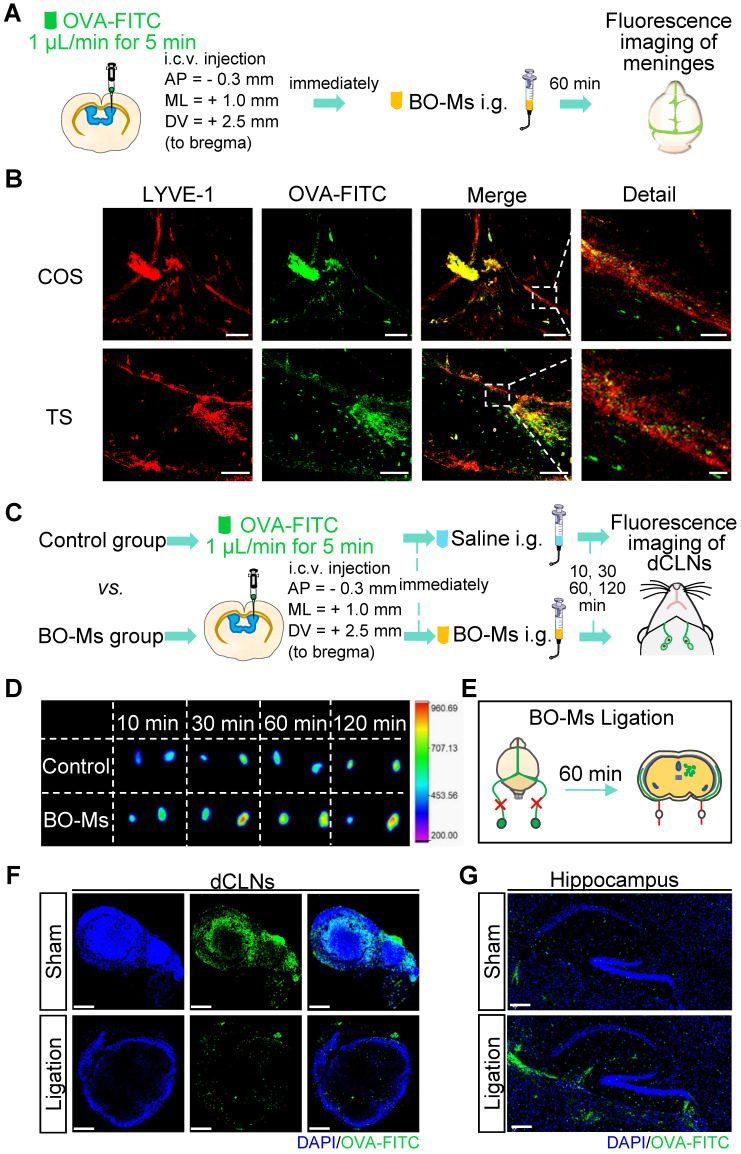
Figure 2.
BO-Ms clear tracers from the CNS into dCLNs via meningeal lymphatics. (A) Schematic of the experimental layout where mice were injected intracerebroventricular (i.c.v.) with OVA-FITC and then intragastrical administration (i.g.) of normal saline as a control group or BO-Ms as BO-Ms group. The meninges were harvested at 60 min after administration. (B) Representative the confluence of sinuses (COS), and the transverse sinus (TS) of meninges stained with anti-LYVE-1 antibody (red) showing OVA-FITC (green) distribution in the meningeal lymphatic vessels of the control group and BO-Ms group at 60 min. (Scale bars in the COS, 200 μm, detail, 50 μm. Scale bars in the TS, 100 μm, detail, 20 μm). (C) Schematic of the experimental layout where mice were injected intracerebroventricular (i.c.v.) with OVA-FITC and then intragastrical administration (i.g.) of normal saline as a control group or BO-Ms as BO-Ms group. The dCLNs were harvested at various times after administration. (D) The Ex vivo fluorescence imaging of OVA-FITC in mice dCLNs in both groups at 10, 30, 60, and 120 min. (E) Schematic of the experimental ligation of the afferent lymphatic vessel of the dCLNs. (F, G) After afferent lymphatic vessel ligation, representative dCLNs and hippocampus in the BO-Ms sham group and BO-Ms ligation group showed OVA-FITC in green and cell nuclei in blue. (Scale bars in the dCLNs sections, 200 μm. Scale bars in the brain sections, 100 μm).

