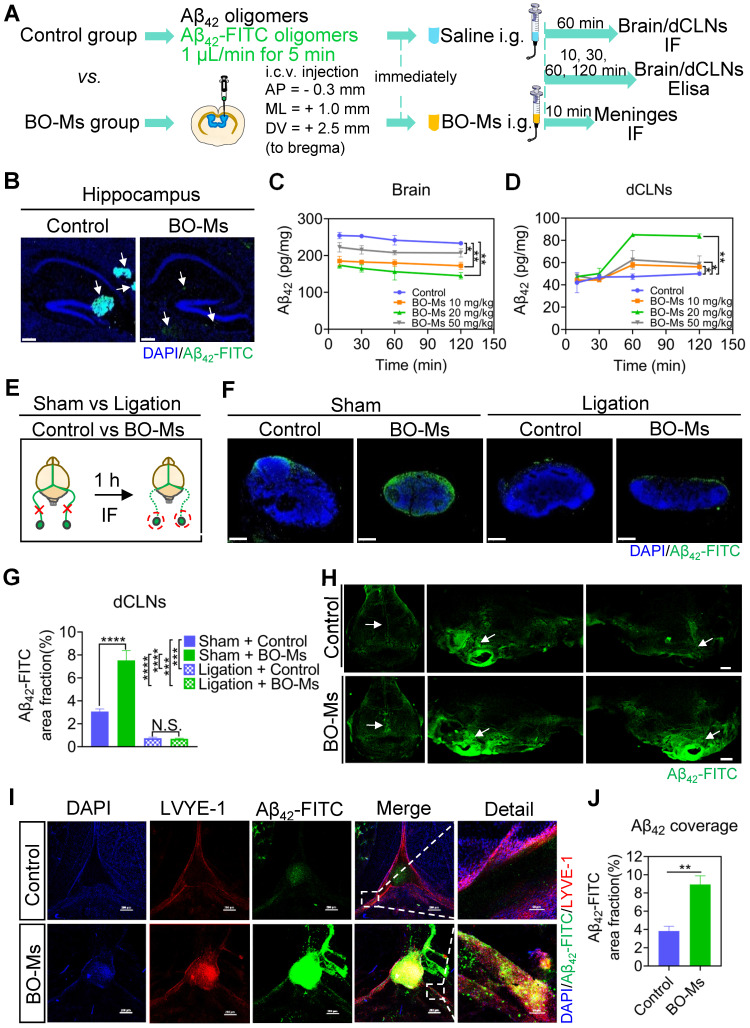
Figure 5.
BO-Ms clear Aβ42 oligomers from the brain into dCLNs via meningeal lymphatic vessels. (A) Schematic of the experimental layout where mice were injected intracerebroventricular (i.c.v.) with Aβ42 oligomers or Aβ42-FITC oligomers and then intragastrical administration (i.g.) of saline or BO-Ms. The brain, meninges and dCLNs of mice in both groups were harvested at different time points. (B) Representative brain sections stained with DAPI (blue) showing Aβ42-FITC oligomers (green) distribution in the hippocampus in the control group and BO-Ms group at 60 min. (Brain parenchyma scale bars, 500 μm, hippocampus scale bars, 200 μm). White arrow: Aβ42-FITC oligomers. (C) Content of Aβ42 oligomers in the brains measured by ELISA. **p < 0.01 (Student's t-test), n = 3 mice per group, representative of two independent experiments. Data are means ± SEM. (D) Content of Aβ42 in the dCLNs measured by ELISA. **p < 0.01 (Student's t-test), n = 3 mice per group, representative of two independent experiments. Data are means ± SEM. (E) Schematic of the experimental ligation of the afferent lymphatic vessel of the dCLNs in the control group mice and BO-Ms group mice. (F) Representative dCLNs sections showing Aβ42-FITC oligomers in green and cell nuclei in blue after afferent lymphatic vessel ligation. (Scale bars, 200 μm). (G) The coverage rate of Aβ42-FITC oligomers (percentage of brain section) in the dCLNs in the sham group and ligation groups with or without BO-Ms treatment. N.S. = not significant, ***p < 0.001, ****p < 0.001 (Student's t-test), n = 3 mice per group, representative of two independent experiments. Data are means ± SEM. (H) Distribution of Aβ42-FITC oligomers in meninges. White arrow: Aβ42-FITC oligomers. (Scale bars, 2 mm). (I) Representative meninges stained with DAPI (blue) and anti-LYVE-1 antibody (red) showed Aβ42-FITC oligomers (green) distribution in the meningeal lymphatic vessels of the control group and BO-Ms group at 10 min. (Scale bars, 200 μm, details figures scale bars, 50 μm). (J) The coverage rate of Aβ42-FITC oligomers (percentage of meninges). **p < 0.01 (Student's t-test), n = 3 mice per group, representative of two independent experiments. Data are means ± SEM.

