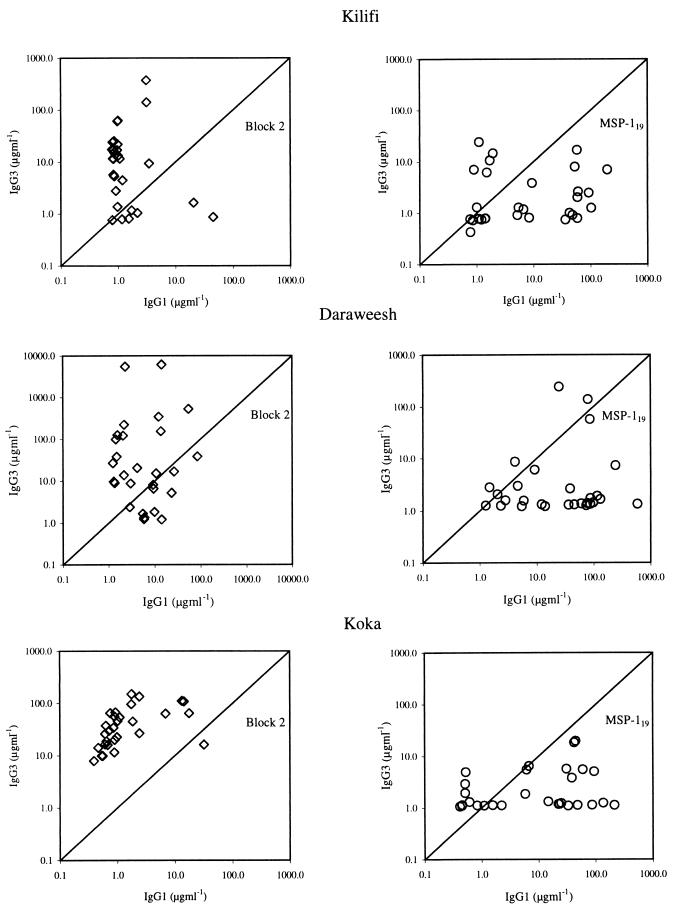
FIG. 1.
Comparisons of IgG subclass levels to Block 2 and MSP-119 regions. Each point shows Ab levels (in micrograms per milliliter) of IgG1 and IgG3 in an undiluted plasma sample from one individual. Ab levels specific for the Block 2 and MSP-119 regions of MSP-1 in the same sets of plasma samples are plotted on adjacent graphs. Results are shown separately for cohorts of donors from Kilifi (Kenya), Daraweesh (Sudan), and Koka (Sudan).

