
Figure 2.
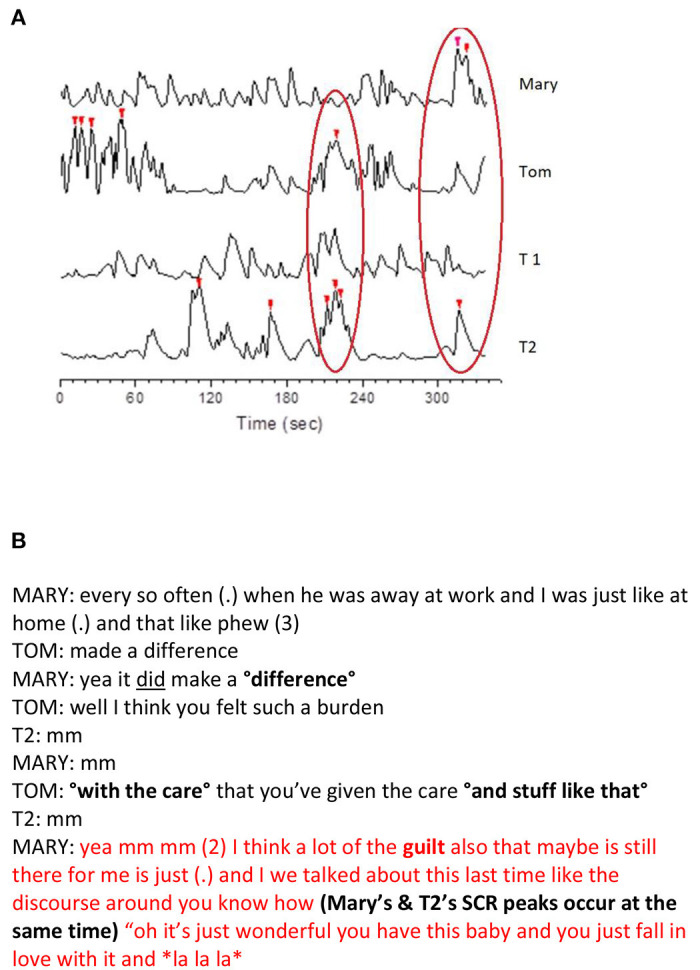
Visualization of the embodied recordings and a transcript of the dialogue during the SCR peaks. (A) The synchronization of the participants' SCR peaks during a short segment of dialogue. The peaks marked with red triangles are the SCRs that were >2 SD of the participant's mean. The left red oval depicts synchrony between Tom and therapist 2 and the right oval depicts synchrony between Mary and therapist 2. (B) The dialogue occurring at the moment of Mary's and therapist 2's highest SCR peaks (right red oval in A). Both panels present a microanalytic study on moments in couple therapy during which there were several SCR peaks between participants. The embodied variables were used together with the transcript of the moment. T1, therapist 1; T2, therapist 2.