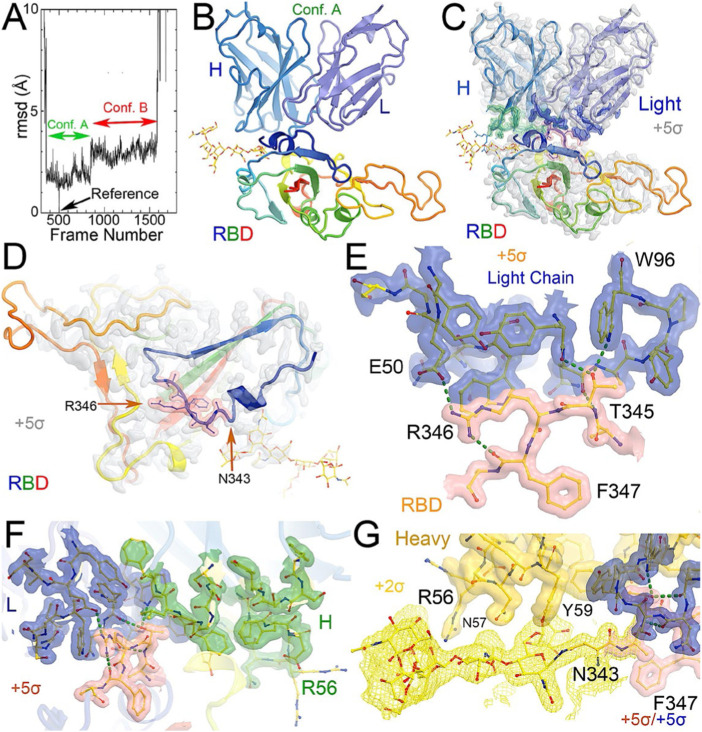
FIGURE 1.
MD-derived electrostatic potential (ESP) maps and the equilibrated structure for NAb conformation. (A) Frames corresponding to conformation A (green arrow) and conformation B (red arrow). (B) Overall structure of conformation A between the spike RBD (rainbow colors with glycosylated N343 in ball-and-stick) and heavy (slate)/light (light blue) chains of the C135 Fab. (C) MD-derived ESP maps contoured at +5σ. Contact interface maps are colored: light chain in blue, heavy chain in green, and RBD in pink. (D) Closeup view of the RBD with the map from (C). (E) Interactions between the RBD and the NAb light chain. (F) Interactions among RBD, heavy/light chains with maps contoured +5σ. (G). Reduced contouring level to +2.5σ for the heavy chain to show the features for N343 glycan.

