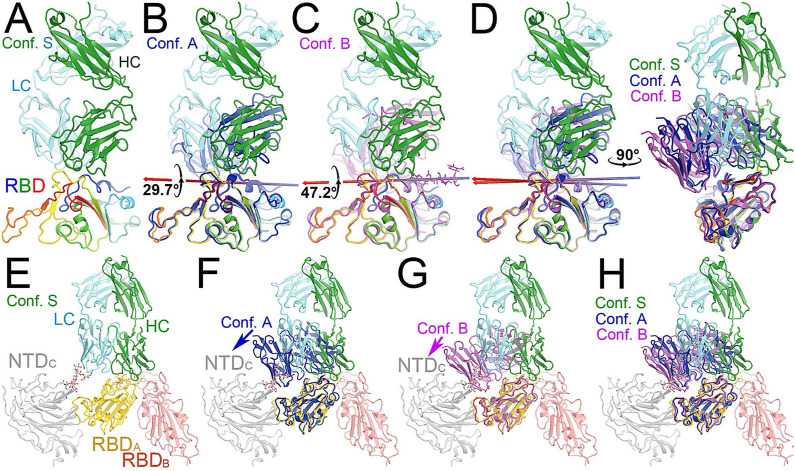
FIGURE 3.
Comparison of MD-derived conformation A (blue) and B (magenta) with the starting conformation S (multicolor). (A) Starting conformation S. (B) Superposition between conformations S and (A). (C) Superposition between conformations S and (B). (D) Two orthogonal views of conformations S, A and (B). (E) Conformation S in context of the spike trimer with NTD and RBD of neighboring subunits included. (F) Superposition of conformations S and A in the context of the spike protein. (G) Superposition of conformations S and B in the trimer. (H) Compiled view of conformation S and A/B in the trimer.

