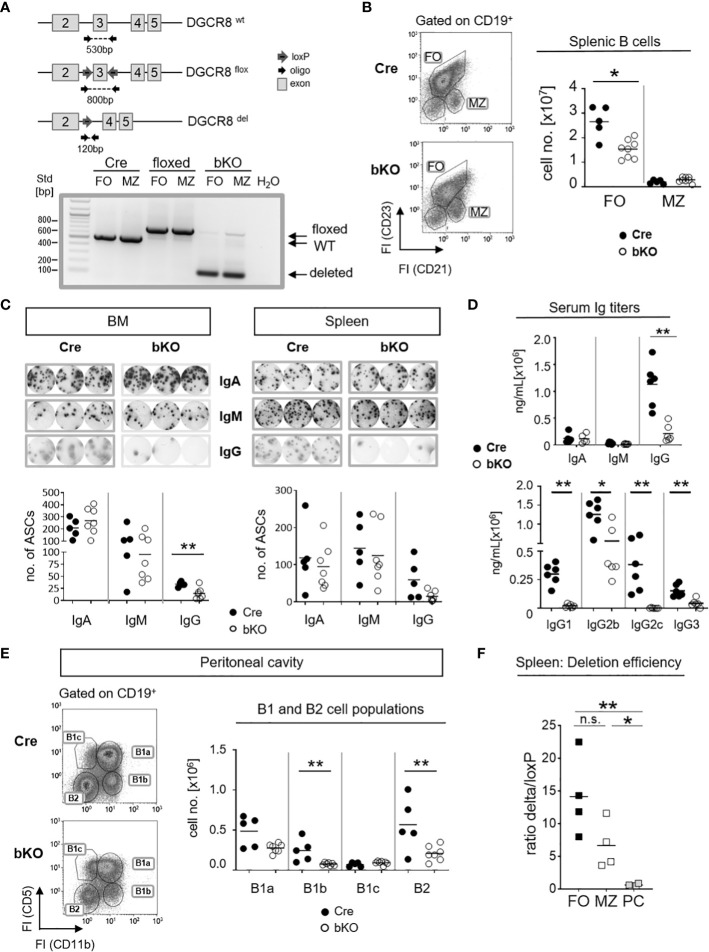
Figure 1.
B cell-specific DGCR8 deficiency impairs the establishment of mature B cells and IgG-secreting cells in vivo. (A) Construction of a mouse carrying a DGCR8 allele with a floxed exon 3 (upper panel). The locus was analyzed by PCR of flow cytometry-sorted MZ B cells (B220+CD19+CD93-CD23lowCD21+) and FO B cells (B220+CD19+CD93-CD23+CD21low) from DGCR8-bKO, Cre-only and floxed-only control mice, respectively. PCR product/amplicon sizes are ~530 bp for the wildtype, ~800 bp for the floxed and ~120 bp for the Cre-deleted DGCR8 allele. (B) Flow cytometry analysis of splenic B cells from DGCR8-bKO (bKO) and Cre control mice. Stained samples were pre-gated on CD19-positive cells. Cell numbers of MZ- and FO B cells in the total spleen cell populations were quantified by flow cytometry using flow count beads. Bars indicate the median of n=5 (Cre) or n=8 (bKO) mice. (C) ELISpot assay to quantify IgA, IgM or IgG-secreting cells in the bone marrow (BM; left panel) and the spleen (right panel) from non-immunized DGCR8-bKO and Cre control animals. Depicted wells show the results from a total of 3,33x10⁴ seeded cells. (D) Serum samples from non-immunized DGCR8-bKO and Cre control mice of 9-18 weeks in age were analyzed by ELISA for total IgA, IgM, IgG and IgG-subclasses. n=6 mice of each genotype. (E) Flow cytometry analysis of samples from peritoneal lavages of DGCR8-bKO and Cre control mice to quantify B1a (CD19+CD5+CD11b+), B1b (CD19+CD5-CD11b+), B1c (CD19+CD5+CD11b-) and B2 (CD19+CD5-CD11b-) cell populations. Cell numbers were calculated per total lavage. (F) Cre-mediated DGCR8-deletion efficiency was analyzed by quantifying PCR amplicon abundances of the loxP-flanked and the deleted DGCR8-allele from sorted FO, MZ and CD138+TACI+- populations of DGCR8-bKO mice ( Figure 1A and Supplemental Figure 1A ). Displayed is the ratio between the deleted allele and the loxP-flanked allele in the same sample. Amplicon abundances were quantified by ImageJ. Bars indicate the median of (B-E) n=5 (Cre) or n=7 (bKO) mice and (F) n=4 mice. Each dot represents one mouse. Mann-Whitney test was used for statistical analysis. **p<0.01; * p<0.05, n.s., not significant.

