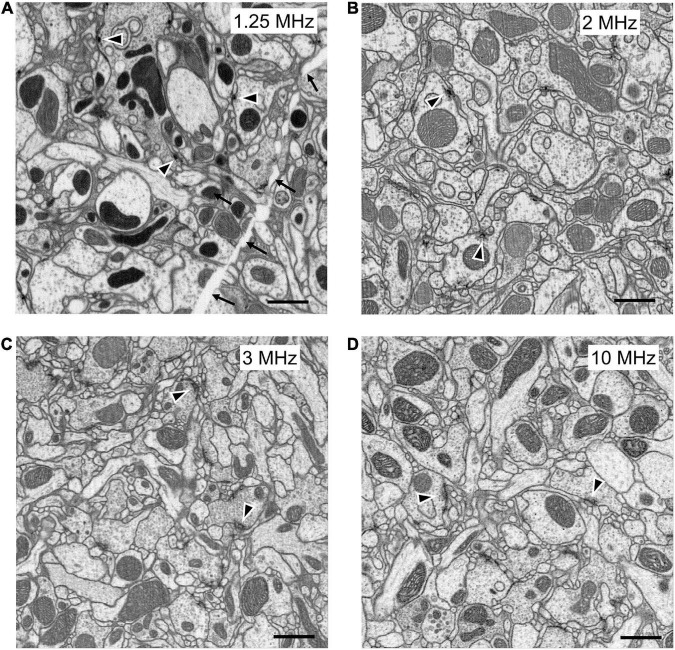
FIGURE 5.
FIB-SEM images, from samples prepared with different methods at different scan rates. All produce images of comparable quality, collected at different imaging speeds. (A) High-pressure freezing with freeze substitution, HPF-FS to compare with (B) progressive lowering of temperature and low-temperature staining (PLT and LTS). (C) Heavy metal enhanced PLT method scanned at 1.5 times the rate (3 MHz) as in (A,B). (D) PLT-LTS progressive heavy metal enhancement, imaged more rapidly than the preceding (C), according to Method 4 in Table 1. Synaptic profiles (arrowheads) are clear in all panels but unavoidable cracks (arrows in A) appear during HPF-FS specimen preparation. Scale bars: 1 μm.

