

Abstract
The incidence of rectal cancer is increasing among patients younger than 50 years. Locally advanced rectal cancer is still treated with neoadjuvant radiation, chemotherapy and surgery, but recent evidence suggests that patients with a complete response can avoid surgery permanently. To define correlates of response to neoadjuvant therapy, we analyzed genomic and transcriptomic profiles of 738 untreated rectal cancers. APC mutations were less frequent in the lower than the middle and upper rectum, which could explain the more aggressive behavior of distal tumors. No somatic alterations showed significant associations with response to neoadjuvant therapy in a treatment-agnostic manner, but KRAS mutations were associated with faster relapse in patients treated with neoadjuvant chemoradiation followed by consolidative chemotherapy. Overexpression of IGF2 and L1CAM was associated with decreased response to neoadjuvant therapy. RNA-Seq estimates of immune infiltration identified a subset of microsatellite stable immune hot tumors with increased response and prolonged disease-free survival.
INTRODUCTION
Colorectal cancer (CRC) is the second leading cause of cancer-related death in the United States.1 Tumors located in the rectum, the distal 12-15 cm of the large bowel, represent one third of CRCs. While the overall incidence of CRC has decreased in the past decades, the incidence of rectal adenocarcinoma is increasing amongst patients younger than 50 years old.2 Despite being historically grouped as a uniform disease, colon and rectal cancers are managed as distinct clinical entities and have different recurrence patterns and associated morbidity.
Surgical removal of the rectum and the mesorectal envelope, an operation called total mesorectal excision (TME), has been the primary treatment of rectal cancer for years. The location of the rectum in the narrow pelvic space surrounded by the urogenital organs and important neurovascular structures makes surgery particularly challenging. In addition to the operative morbidity, the long-term functional sequelae, the need for a temporary or permanent stoma and the impairment of quality of life, surgery for rectal cancer is associated with a higher rate of local recurrence compared to colon cancer.3 Therefore, unlike colon cancer, patients with locally advanced rectal cancer (LARC) are treated with neoadjuvant therapy (NAT), consisting of radiation and chemotherapy, to reduce the risk of local recurrence and increase the likelihood of sphincter preservation. Most rectal cancers show some degree of response to NAT, spanning from minimal response to complete tumor eradication. A complete response (CR) is associated with low recurrence rates and excellent survival, challenging the benefit of TME surgery and creating opportunities for organ preservation (OP)4 in up to 50% of LARC patients.5 The wide variability in reported CR rates cannot be fully explained by macroscopic tumor characteristics such as tumor location, size and stage, nor by differences in treatment alone.6,7 Identifying biomarkers of response to NAT may help prognosticate and develop strategies to increase the proportion of responders.
While prior studies have linked molecular features such as KRAS mutations to treatment resistance,8,9 the genomic determinants of response to NAT have not been systematically studied. Previous analyses have been limited by small sample sizes.10 Large-scale sequencing efforts such as those from The Cancer Genome Atlas (TCGA) focused on untreated surgical resections and therefore failed to include a significant representation of LARC samples due to the scarcity of treatment-naive specimens.11,12 We analyzed DNA and RNA extracted from preoperative endoscopic biopsies from tumors located all along the rectum with comprehensive clinicopathological annotations to investigate the biology of rectal cancer at an unprecedented resolution.
We report an integrative analysis of genomic and transcriptomic profiles in 738 patients diagnosed with rectal adenocarcinoma. We first delineate the molecular landscape of somatic alterations across different tumor stages, highlighting biologically relevant differences by rectal location that could better illuminate previously observed variations in prognosis. We then identify somatic alterations, transcriptomic features and immune infiltration profiles that correlate with differences in clinical outcomes for LARC patients treated with NAT.
RESULTS
Our study included 738 patients from four different sources: (1) 25 patients from the ACOSOG Z6041 trial (NCT00114231)13 [“ACOSOG” cohort], 71 patients from the Timing of Rectal Cancer Response to Chemoradiation (TIMING) trial (NCT00335816) 6 [“TIMING” cohort], 163 patients treated at Memorial Sloan Kettering (MSK) and sequenced using research protocols [“MSK-Research” or “MSK-R” cohort], and 479 patients sequenced as part of their care at MSK [“MSK-Clinical” or “MSK-C” cohort]. Patients were profiled using a combination of DNA and RNA sequencing platforms (Extended Data Figure 1A). Their clinical and histopathological features are provided in Table S1 and summarized in Table S2. Key features for the cohorts used in our study are provided in Table S3. Diagrams delineating the patients used in each of our analyses and their key clinical features are provided in Extended Data Figure 1B–H.
Clinical and genomic characterization of rectal cancer
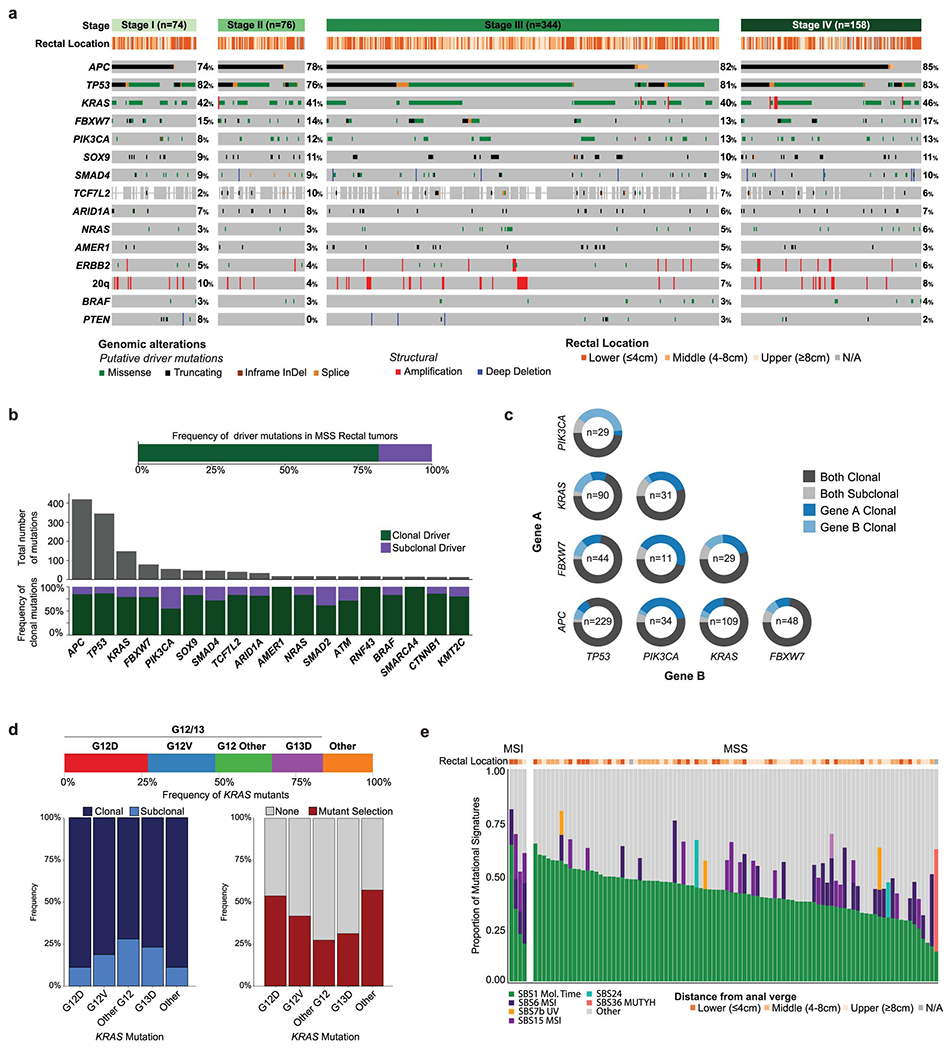
We analyzed DNA-sequencing data from 692 pre-treatment, primary specimens profiled using MSK-IMPACT, an FDA-authorized sequencing assay targeting 341-505 cancer-related genes (Figure 1, S1C). Patients had stage I (n=78), II (n=77), III (n=375), and IV (n=162) disease. Tumors were located in the lower (LR: 0-4 cm from the anal verge, n=257), middle (MR: 4-8 cm, n=197), and upper rectum (UR: 8-12 cm, n=204); detailed rectal location was unavailable for 34 specimens. Most tumors (652/692, 94.2%) were mismatch repair proficient/microsatellite stable (pMMR/MSS); the rest were mismatch repair deficient/microsatellite unstable (dMMR/MSI) (36/692, 5.2%) or POLE hypermutants (4/692, 0.6%). Within pMMR/MSS tumors, the most frequently altered genes were APC (81%), TP53 (81%), KRAS (42%), FBXW7 (14%), and PIK3CA (12%) (Figure 1A). The most commonly altered signaling pathways14 were WNT (85%), TP53 (82%), and RAS (51%) (Figure 1B). No significant differences in the frequency of driver alterations were observed across tumor stages (Extended Data Figure 2A) and 82% of driver mutations were clonal (Extended Data Figure 2B). Alterations in KRAS and AMER1 were significantly co-occurring (q<0.05), whereas alterations in TP53 were mutually exclusive with alterations in PIK3CA and KRAS (q<0.1) (Figure 1C). APC mutations within the C-terminus co-occurred significantly with mutations in KRAS and AMER1 (Figure 1C), consistent with reports of different co-mutation patterns by APC mutation side.15 Additionally, oncogenic PIK3CA mutations were subclonal in about one third of the cases where they co-occurred with either APC or TP53 mutation, suggesting that they may be a late event (Extended Data Figure 2C).
Figure 1. The genomic landscape of rectal cancer.
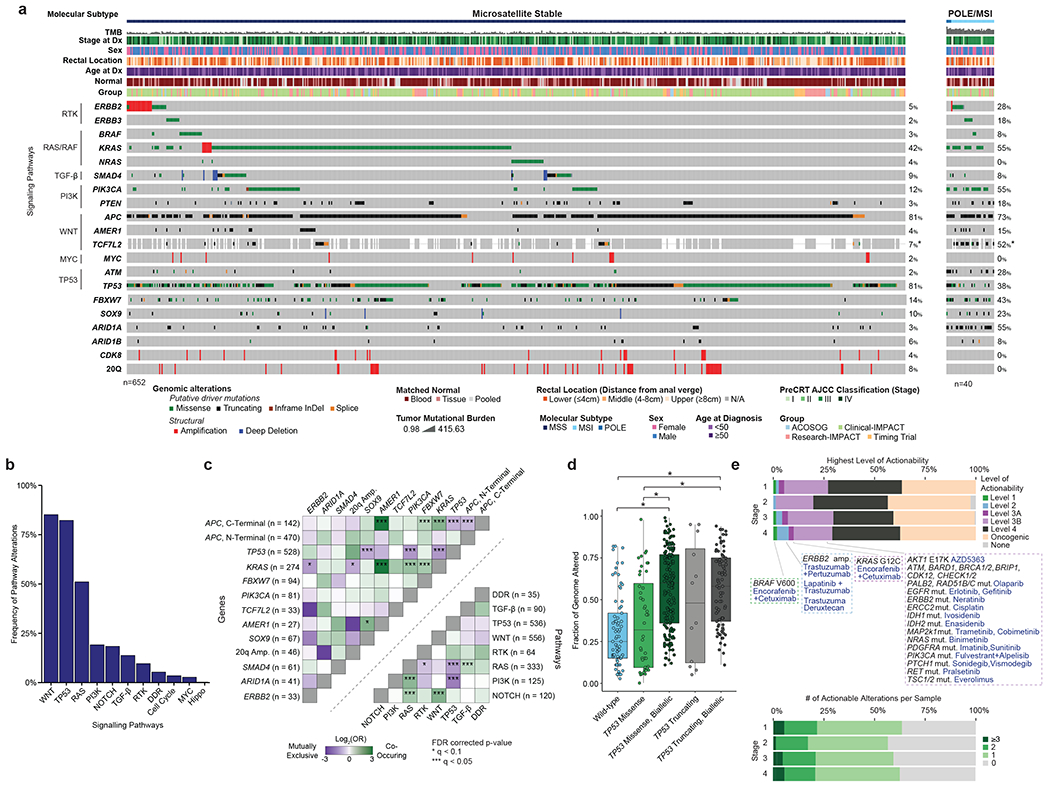
(A) Oncoprint showing the most frequently altered genes in rectal cancer, stratified by pMMR/MSS and POLE/dMMR/MSI patients. Asterisk indicates samples for which the gene was not present on the panel. (B) Bar plots showing frequency of alterations in a set of selected oncogenic signaling pathways. (C) Patterns of co-occurrence and mutual exclusivity at the gene and pathway level. C- and N-Terminal mutations in the APC gene were analyzed separately. Statistical significance was assessed using a two-sided Fisher’s exact test. P values were corrected using the false discovery rate (FDR) method and significant results were denoted as * indicating q <0.1 and *** indicating q<0.05. (D) Fraction of genome altered by copy number changes for TP53 missense/truncating mutations stratified by biallelic inactivation status. Results are shown for 408 MSS cases from the MSK-C cohort that passed quality-control criteria for FACETS analysis. The following groups: wild-type (n=73), TP53 Missense (n=44), TP53 Missense, Biallelic (n=175), TP53 Truncating (n=12), and TP53 Truncating, Biallelic (n=81) were compared using a two-sided Mann-Whitney U test. Significant results were as follows: wild-type vs TP53 Missense, Biallelic p=1.32e-12; wild-type vs TP53 Truncating, Biallelic p=2.826e-10; TP53 Missense vs TP53 Missense, Biallelic p=6.755e-06; TP53 Missense vs TP53 Truncating, Biallelic p=5.762e-05. Boxplots’ center lines indicate medians, edges indicate the interquartile range, and the whiskers extend to the highest and lowest values not considered outliers. (E) Highest level of therapeutic actionability and number of actionable alterations in pMMR/MSS tumors stratified by stage at diagnosis.
dMMR/MSI tumors had fewer TP53 mutations (38% vs. 81%, p<0.001) and whole genome duplication (WGD) events (0% vs. 40.1%, p=0.026).16 Among the pMMR/MSS cases, inactivation of TP53 correlated with chromosomal instability measured as the fraction of genome altered by copy number changes (FGA), consistent with previous pan-cancer reports.17,18 Samples with biallelic inactivation of TP53 exhibited higher FGA (Figure 1D), and truncating mutations were associated with higher FGA than missense mutations. Oncogenic KRAS alterations were detected in 274/652, 42% of the pMMR/MSS tumors, with the majority being clonal and occurring at the G12 or G13 codons (Extended Data Figure 2D).
We analyzed mutational signatures in whole-exome sequencing (WES) data from 97 tumors (Table S1, Extended Data Figure 1D, S2E). The most frequent signature was SBS1, a mitotic clock signature associated with aging. Signatures associated with defective DNA mismatch repair (SBS6 and SBS15) were enriched among dMMR/MSI tumors (Extended Data Figure 2E). A strong SBS36 signature, associated with alterations in the MUTYH gene, was observed in one of the pMMR/MSS patients. MutSigCV analysis19 using the WES data did not identify any recurrently mutated genes beyond those included in MSK-IMPACT (Table S4).
Among pMMR/MSS patients, 28% of tumors harbored at least 1 therapeutically actionable alteration as defined in OncoKB,20 ranging from standard-of-care (Levels 1 or 2) to investigational therapies (Levels 3) (Figure 1E). The only Level 1 alterations were BRAF V600E mutations, observed in 1% of the tumors. Level 2 alterations were ERBB2 amplifications, seen in 3% of the tumors. Level 3A alterations were KRAS G12C mutations, seen in 2% of the tumors. Level 3B alterations, which predict response to an existing drug in other cancer types, included mutations in PIK3CA (12%), NRAS (4%), and ATM (2%) (Figure 1E). However, confirmed lack of sensitivity in CRC suggests that these alterations are likely not actionable in rectal cancer patients. 21–24
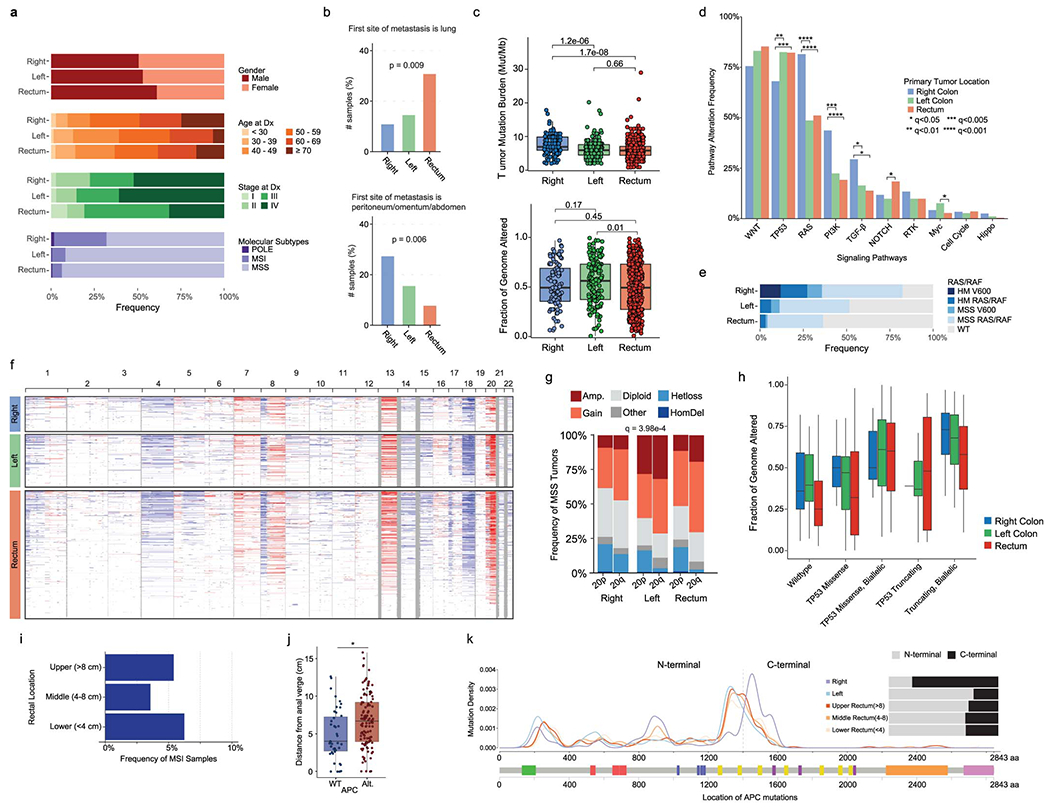
Comparison of colon and rectal adenocarcinomas
We compared our rectal adenocarcinomas to primary, untreated proximal colon adenocarcinomas (PCAs, “right-sided”) and distal colon adenocarcinomas (DCAs, “left-sided”).11,25 We restricted our analysis to the 479 cases in our MSK-C cohort, which had been analyzed using normal DNA from matched blood. We compared these to a published cohort of 178 PCAs and 204 DCAs processed with identical methods [“MSK-Colon” cohort, Tables S3, S5].25 No significant differences in gender, age or stage were observed (Extended Data Figure 3A). Rectal cancer had higher rates of lung and lower rates of peritoneal and abdominal metastasis (Extended Data Figure 3B). Hypermutated samples were more common among PCAs (Extended Data Figure 3A). Among pMMR/MSS samples, tumor mutational burden (TMB) was significantly higher in PCAs (Extended Data Figure 3C). Although no differences in FGA were observed (Extended Data Figure 3C), 20q amplification was more frequent in DCAs (Extended Data Figure 3F/G, q<0.05). PCAs had more RAS and PI3K pathway alterations (q<0.001), while TP53 pathway alterations were more frequent in rectal tumors (q<0.005) (Extended Data Figure 3D). The differences in FGA by TP53 status discussed above were also observed in PCAs and DCAs (Extended Data Figure 3H). A majority of APC mutations were located within the C-terminus in rectal tumors and DCAs, whereas in PCAs APC variants mainly occurred in the N-terminus (Extended Data Figure 3K).
APC alterations are less frequent in lower rectal tumors
No differences in stage or frequency of dMMR/MSI status were observed by rectal location (Extended Data Figure 3I). In pMMR/MSS tumors, Wnt pathway alterations were significantly less frequent with increasing proximity to the anal verge (92% in UR, 90% in MR and 77% in LR, p<0.001, Figure 2A). These differences were driven by APC alterations, as APC altered cases tended to be located higher up in the rectum (median 6.85 cm vs 4 cm, p<0.001, Figure 2B). We replicated this observation in an independent cohort of 157 primary rectal tumors from MSK patients (p<0.001, Extended Data Figure 3J) [“MSK-OtherRectal” cohort, Tables S3, S5]. To further investigate this, we analyzed 9 anal adenocarcinomas from the MSK-IMPACT clinical series [“MSK-Anal” cohort, Tables S3, S5]. Only one of these (1/9, 11%) harbored Wnt alterations, consistent with the hypothesis of Wnt pathway activation being less frequent near the anal verge (Figure 2C). Biallelic inactivation of APC was also less frequent in LR tumors and anal adenocarcinomas (p<0.001, Figure 2D). No remarkable differences in the frequency of C-terminal vs. N-terminal APC mutations were observed across rectal segments (Figure 2E).
Figure 2. Differences in WNT signaling across the rectum.
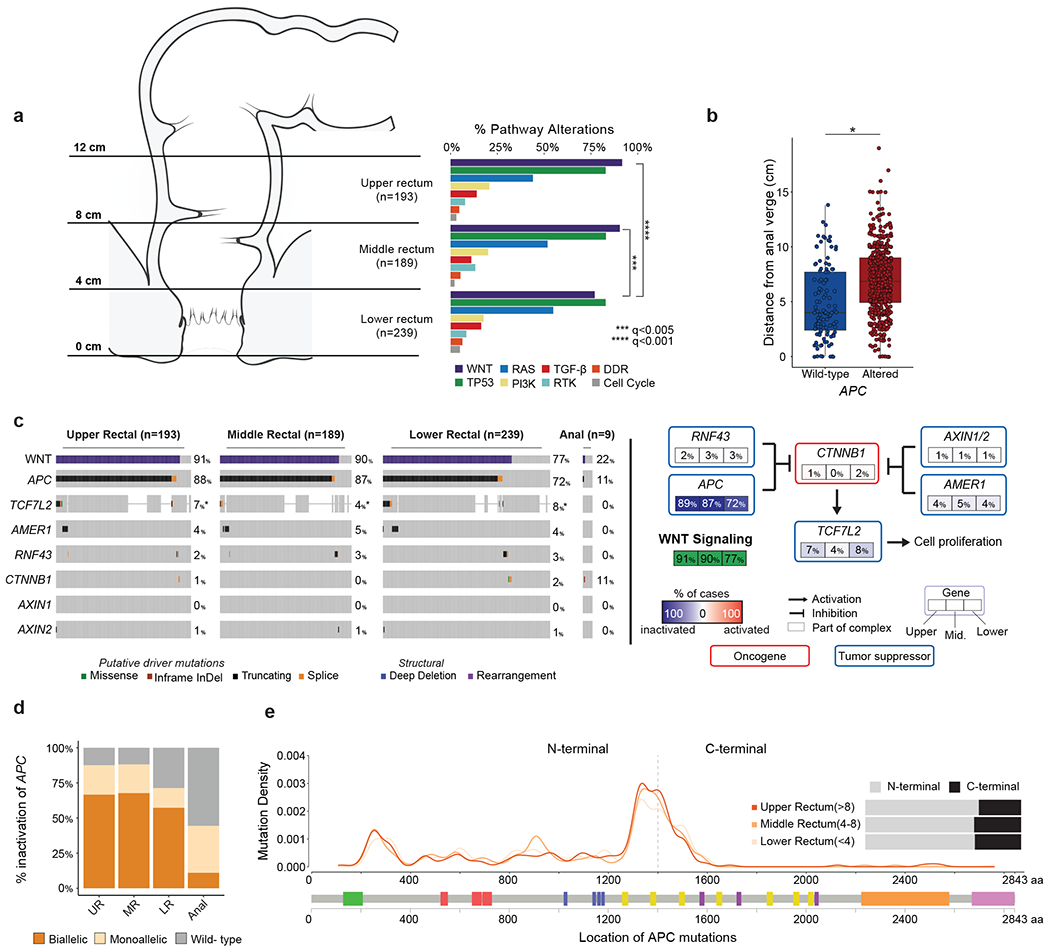
(A) Frequency of signaling pathway alterations stratified by anatomic location across the rectum. Statistical significance was assessed using a two-sided Fisher’s exact test and p values were corrected for multiple testing using the false discovery rate method, *** indicates q<0.005 and **** indicates q<0.001. Significant results are as follows: WNT pathway, upper rectum (92%) vs lower rectum (77%), q=4.45e-4, and middle rectum (90%) vs lower rectum (77%), q=2.78e-3. (B) Distance to the anal verge by APC status. APC WT (n=113) were compared to APC altered (n=508) using a two-sided Mann-Whitney U test, * indicates p=1.20e-9. Boxplots’ center lines indicate medians, edges indicate the interquartile range, and the whiskers extend to the highest and lowest values not considered outliers. (C) WNT pathway alteration frequencies across the rectum and in a selected set of sequenced anal adenocarcinomas. Asterisk indicates samples for which the gene was not present on the panel. (D) Proportion of biallelic inactivation of APC across the rectum and a curated set of sequenced anal adenocarcinomas. (E) Distribution of APC mutations by genomic location for tumors from the lower, middle, and upper rectum.
Genomic determinants of response to therapy
To identify determinants of response to NAT in LARC, we analyzed 346 patients with stage II (16%) or stage III (84%) disease (Extended Data Figure 1E, Tables S6). The median follow-up time was 45.2 months. These patients came from the TIMING (n=71), MSK-R (n=127) and MSK-C (n=148) cohorts (Tables S3, S6). The TIMING set included larger fractions of stage II patients and UR cases (Figure 3A). All the TIMING patients were treated with neoadjuvant chemoradiation (CRT), either in isolation or followed by consolidative chemotherapy (CRT-CNCT), and had surgery after NAT. By contrast, most patients in the MSK-R and the MSK-C cohorts were treated with neoadjuvant induction chemotherapy followed by chemoradiation (INCT-CRT) (Figure 3A). A small number of patients in the MSK-R cohort (7/127, 6%) and a larger subset in the MSK-C cohort (51/148, 34%) had a sustained clinical CR and achieved OP for at least 2 years (Figure 3A). This strong shift in treatment paradigms reflect the different periods of accrual for the three cohorts (Figure 3B).26 While the rate of OP increased gradually (Figure 3C), the rate of CR – pathological CR plus clinical CR – remained stable over the years and no significant differences in disease-free survival (DFS) were observed across cohorts (Figure 3D).
Figure 3. Clinical and genomic determinants of response to NAT in LARC.
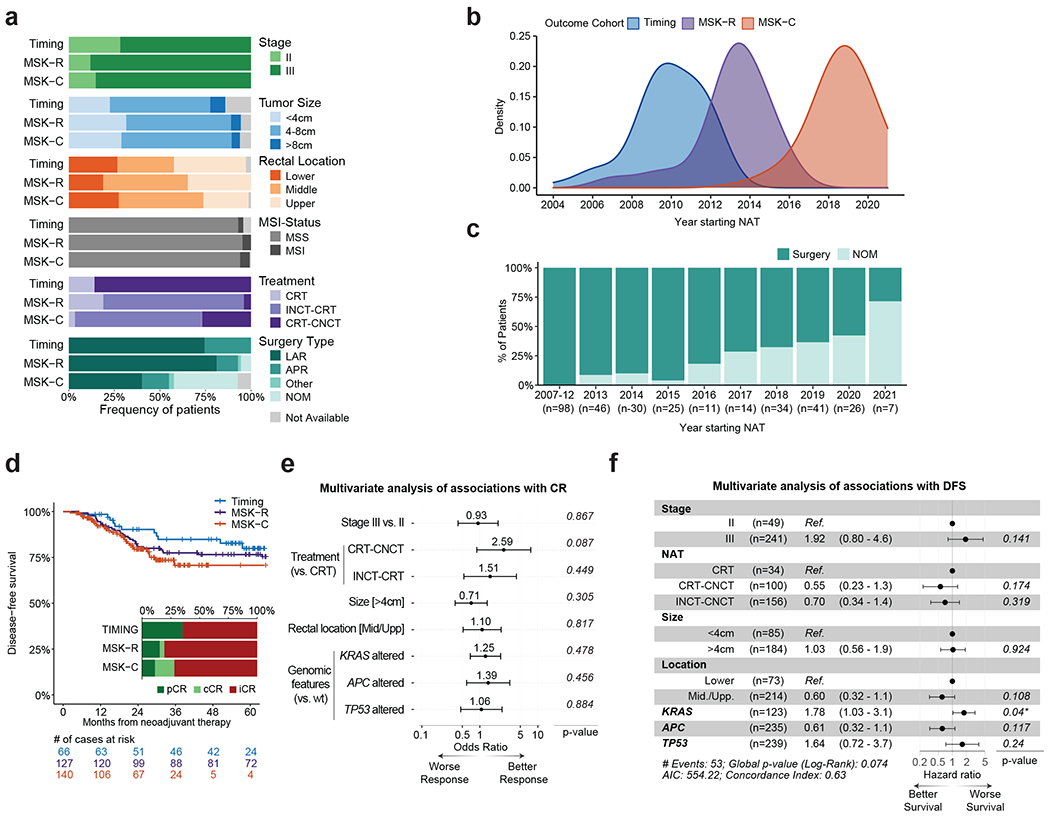
(A) Overview of clinicopathological features for the LARC patients used for outcome analyses in our study. (B) Distribution of years for beginning of NAT for patients in the TIMING, MSK-R and MSK-C cohorts. (C) Fraction of patients benefiting from OP at the time of last follow-up, stratified by year of NAT initiation. All these patients came from the MSK-R and MSK-C cohorts. (D) Comparison of DFS for the patients in the TIMING, MSK-R, and MSK-C cohorts. Inset shows the fraction of patients with either a pathological complete response (pCR), a clinical complete response (cCR), or a incomplete response (iCR), stratified by cohort. (E) Multivariate analysis of associations between clinical and genomic variables and CR (n=263). Odds ratios and associated p-values were computed using a multivariate logistic regression model that included all of the clinical and genomic variables shown in the panel. Odd ratio values above one are associated with better CR rates.The error bars indicate the 95% confidence interval for each odds ratio. (F) Multivariate analysis of associations between clinical and genomic variables and DFS. Hazard ratios and p-values were computed using a Cox proportional-hazards model that included all of the clinical and genomic variables shown in the panel. Hazard ratios above one are associated with worse DFS. The numbers in brackets and the length of the error bars show the 95% confidence interval for each hazard ratio.
We investigated associations between clinical features, somatic DNA alterations and outcomes from NAT in 306 patients with available MSK-IMPACT data (Extended Data Figure 1E). Since dMMR/MSI tumors have been shown to respond differently to NAT,27 we focused on the 290 pMMR/MSS patients. No somatic alterations differed in frequency across cohorts (Extended Data Figure 4A,B). The APC, TP53 and KRAS genes were included in multivariate analyses because they were altered in ≥15% patients, and also based on previously reported associations with outcome.8–10,15 A multivariate logistic regression model did not identify any significant associations between clinical variables, genomic variables and CR (Figure 3E). Similarly, multivariate analysis using Cox proportional-hazards to evaluate DFS from start of NAT did not detect any strongly significant associations with clinical or genomic variables (Figure 3F), although the association between KRAS mutations and shorter DFS was borderline significant (p=0.04). After treatment stratification, KRAS mutations were associated with significantly shorter DFS in patients treated with CRT-CNCT (p=0.004, Extended Data Figure 4C), but not in patients treated with INCT-CRT (p=0.122, Extended Data Figure 4D). By contrast, KRAS mutations were not associated with significantly different rates of CR in CRT-CNCT treated patients (25% vs. 41%, p=0.277, Extended Data Figure 4C), and they exhibited a borderline non-significant association with improved CR in patients treated with INCT-CRT (33% vs. 15%, p=0.056, Extended Data Figure 4D). Further testing of genes altered in ≥5% of all cases did not identify any additional associations with CR or DFS (Table S7).
Transcriptomic determinants of response to therapy
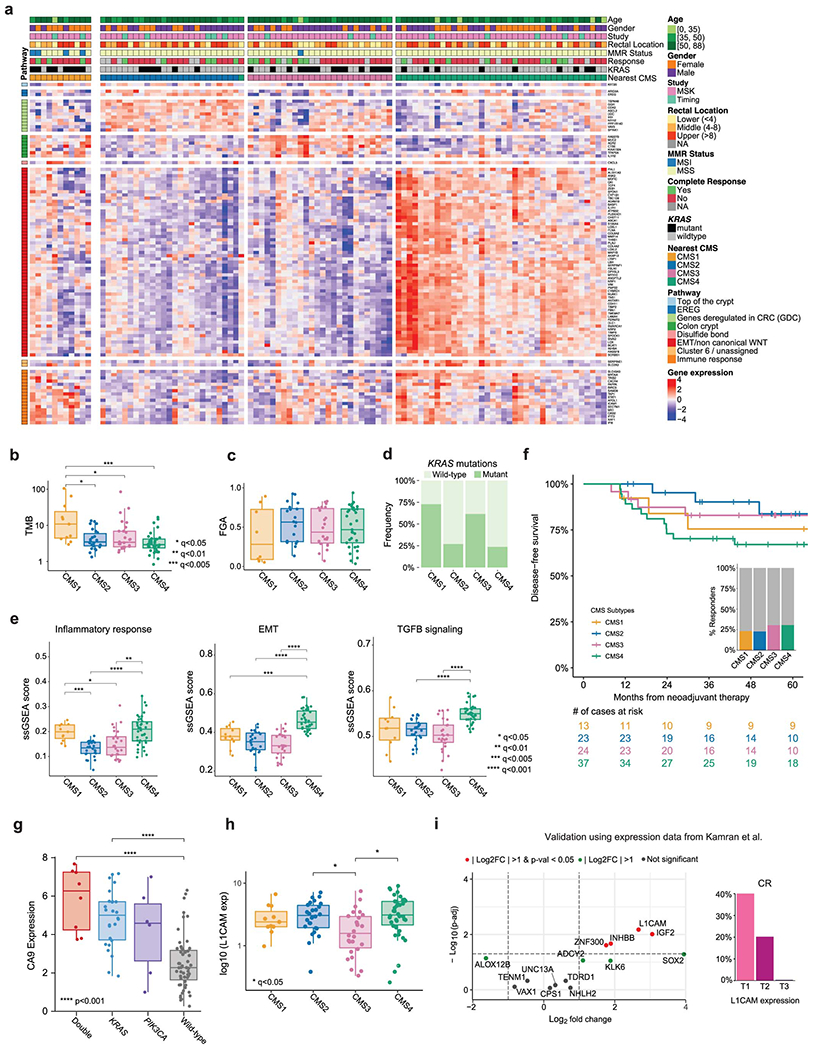
We performed RNA-seq on pre-treatment endoscopic biopsies from 114 patients, including 97 patients treated with NAT that qualified for outcome analyses (Extended Data Figure 1G). Tumors were stratified using the consensus molecular subtypes (CMS) classification and exhibited molecular patterns consistent with previous reports (Extended Data Figure 5A–E).28 CMS4 patients had the worst DFS, while CMS2 patients exhibited slightly better DFS than CMS1 and CMS3 patients (Extended Data Figure 5F).
Among pMMR/MSS patients, expression of carbonic anhydrase 9 (CA9) - a hypoxia-inducible protein reported to have prognostic value 29,30 - was increased in tumors with mutated KRAS or PIK3CA, particularly in the double-mutants (p<0.001) (Extended Data Figure 5G). An analysis of differentially expressed genes in CR vs. incomplete-response (iCR) patients identified lower expression of 7 genes and increased expression of 8 genes in the iCR group. Genes overexpressed in iCR patients included insulin-like growth factor 2 (IGF2) and L1 cell adhesion molecule (L1CAM) (Figure 4A, Table S8). Strong IGF2 overexpression was seen in a small subset of tumors and was mutually exclusive with PI3K pathway alterations, as previously reported in CRC (Figure 4B).11 High levels of L1CAM were more frequent in CMS4 samples and correlated with lower CR, shorter DFS and higher rates of metastasis (Figure 4C, S5H). We validated the presence of L1CAM-expressing tumor cells in matched pre- and post-treatment samples from a patient with available material using immunohistochemistry (IHC) staining (Figure 4C). Our results show that L1CAM expression is detectable pre-treatment and increases throughout NAT in iCR patients, as previously reported.31 Overexpression of IGF2 and L1CAM in iCR patients was validated using an independent cohort of 15 LARC patients treated with NAT from Kamran et al. (Extended Data Figure 5I).10 No additional associations between gene expression and DFS were identified based on a systematic analysis adjusted by treatment (Table S8).
Figure 4. Transcriptomic determinants of response to NAT in LARC.
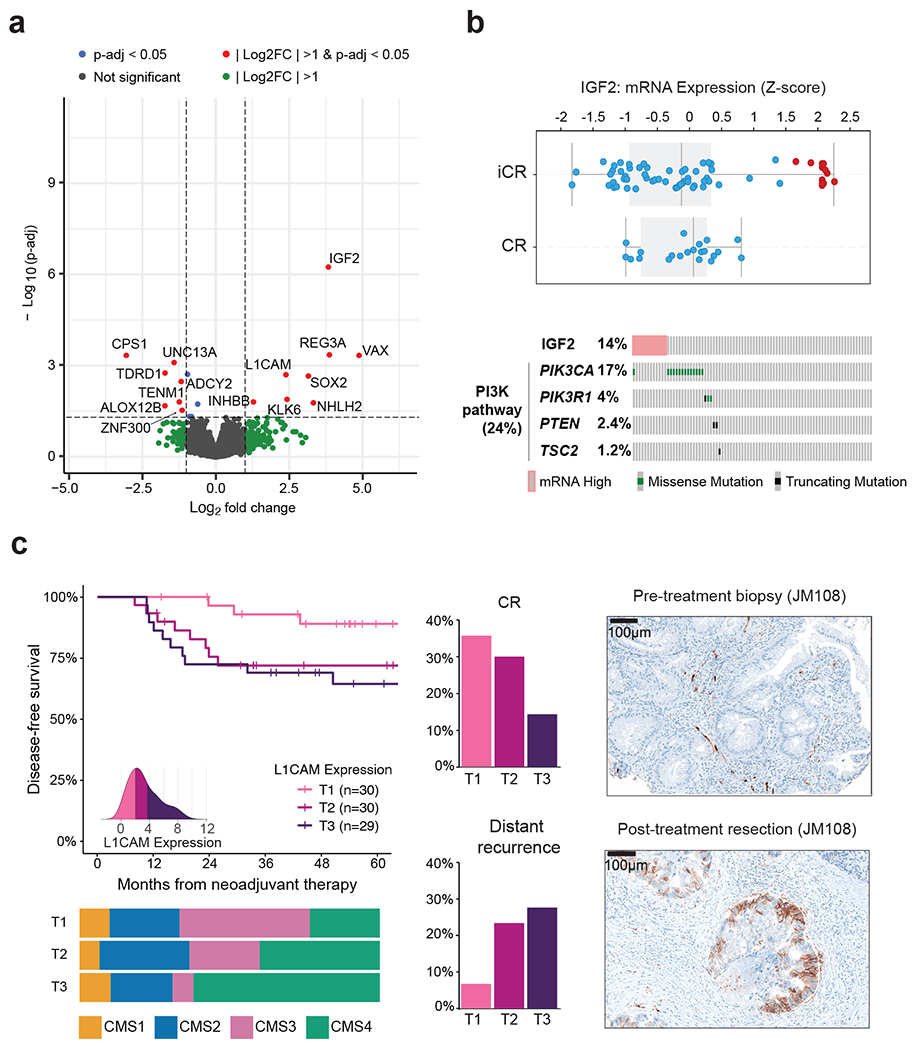
(A) Volcano plot illustrating differentially expressed genes in CR vs. iCR patients. Differential gene expression was conducted using DESeq2 and the p-values computed using the Wald test were corrected for multiple testing using the false discovery rate method. (B) IGF2 expression of CR (n=26) compared to iCR (n=68) patients. All the patients in the high IGF2 expression group (n=12) exhibited iCRs. Also, none of these patients had somatic alterations within the PI3K pathway. Boxplots’ center lines indicate medians, edges indicate the interquartile range, and the whiskers extend to the highest and lowest values not considered outliers. (C) Higher expression of L1CAM was observed in tumors with poor outcomes. T1-T3 labels represent sample stratification by population tertile. A density plot showing the distribution of expression values per tertile is shown as an inset. Expression of L1CAM was negatively correlated with DFS and rate of CR, but positively correlated with rate of distant recurrence. Tumors in the top tertile of L1CAM expression (T3) included a higher fraction of CMS4 specimens. IHC staining of L1CAM in matched pre- and post-treatment samples shows that it can be detected at pre-treatment and that observed levels increase during treatment, as previously reported.
Immunological determinants of response to therapy
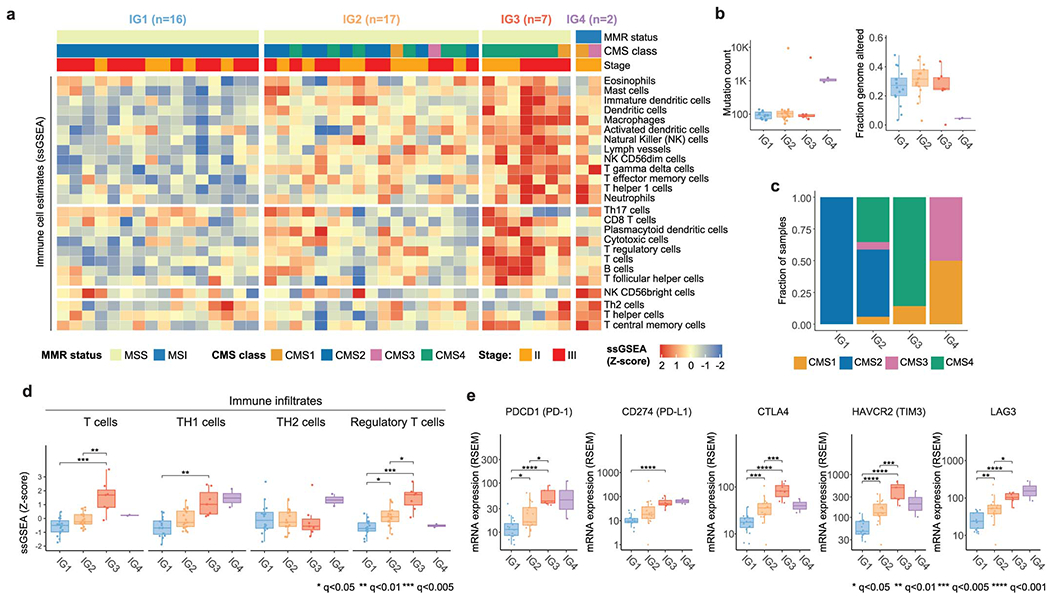
We investigated the role of the tumor immune microenvironment in response to NAT. We computed single-sample gene set enrichment analysis (ssGSEA) scores for 101 patients with sequenced DNA and RNA (Extended Data Figure 1A) using known CRC immune signatures.32 Since dMMR/MSI tumors have a distinct immunologic profile, we separated them into their own group (“IG4”, n=5) and performed unsupervised hierarchical clustering on the 96 pMMR/MSS tumors (Figure 5A). We identified a set of immune hot tumors (“IG3”, n=7) with extensive immune infiltration. The remaining tumors were grouped into a set with intermediate (“IG2”, n=37) and low (“IG1”, n=52) immune infiltration. Tumors in IG1-IG3 had lower TMB, while FGA was lower in tumors from IG3 and IG4 (Figure 5B). This is consistent with MSI tumors being more likely to have near-diploid genomes and few copy number changes,11,25 and also with prior reports of cytotoxic immune infiltrates being negatively correlated with somatic copy number alterations.33 Tumors in IG3 exhibited higher ssGSEA scores for overall inflammatory response (Figure 5B). A majority of samples from both IG2 and IG3 belonged to the CMS4 group, suggesting that immunological profiling can be used to further refine the CMS classification (Figure 5B). Mutations in APC and TP53 were less frequent within the IG3 and IG4 groups, while KRAS mutations were less frequent in IG2 (Figure 5C). Hematoxylin-eosin (H&E) staining of the tumor slides shows higher fraction of inter-tumoral tumor infiltrating lymphocytes (TILs) in representative samples from the IG3 group than the IG1 and IG2 groups (Figure 5D, S6A, Table S9). CD3 immunofluorescence (IF) staining levels were positively correlated with ssGSEA scores for T cells (p<0.001), as were CD4 IF staining levels and RNA signatures of T helper cell infiltration (p<0.01) (Figure 5E).
Figure 5. Immune profiling identifies a subset of immune hot pMMR/MSS LARC tumors with favorable outcomes from NAT.

(A) Unsupervised hierarchical clustering of pMMR/MSS tumors using ssGSEA scores for immune signatures reveals three groups with increasing levels of immune infiltrates (IG1-IG3). dMMR/MSI tumors were added later as a fourth group (IG4). (B) Comparison of TMB, FGA, inflammatory response signature and CMS labels for IG1 (n=52), IG2 (n=37), IG3 (n=7), and IG4 (n=5). (C) Mutations in APC and TP53 occurred at lower frequencies in IG3 and IG4 (p=0.008 and p=0.005, respectively; Fisher’s exact test), while mutations in KRAS were less frequent in IG2 (p=0.011). (D) H&E staining of 21 cases shows a higher fraction of inter-tumoral TILs in IG3 (n=6) than IG1 (n=6) (q=0.0288) and IG2 (n=6) (q=0.0288). H&E images illustrate the higher fraction of TILs in a representative IG3 case compared to a representative IG1 case. (E) Levels of CD3 and CD4 quantified by IF staining correlated with RNA-Seq ssGSEA scores for T cells and T helper cells. Statistical significance was assessed based on two-sided Spearman correlation. Error bands show 95% confidence intervals. (F) IG3 and IG4 patients exhibited better DFS and better response rates than IG1 & IG2 patients, although differences were not significant. (G) Selected significant differences in ssGSEA scores for specific immune cell types and oncogenic signaling pathways.35 (H) Expression levels for genes encoding proteins involved in immune checkpoint blockade. In panels (G) and (H), sample sizes are as follows: IG1 (n=52), IG2 (n=37), IG3 (n=7), and IG4 (n=5). In panels (B), (D), (G) and (H), statistical significance was assessed using a two-sided Mann-Whitney U test. P values were corrected using the Bonferroni method and significant results were denoted as * indicating q <0.05, ** indicating q<0.01, *** indicating q<0.005, and **** indicating q<0.001. Boxplots’ center lines indicate medians, edges indicate the interquartile range, and the whiskers extend to the highest and lowest values not considered outliers.
Next, we focused on 87 patients with DNA, RNA and outcome data (Extended Data Figure 1H). The IG4-dMMR/MSI and the IG3-immune-hot groups exhibited better response and DFS (Figure 5F). We compared ssGSEA scores for immune infiltrates and oncogenic signaling pathways implicated in tumor progression 32,34,35 (Figure 5G, S6B, S6C). The T cell profile was higher in IG3 and IG4 tumors. This signal was driven by higher levels of Th1 cells in IG3, which produce inflammatory cytokines (e.g., IFN-gamma) and are associated with antitumor immunity.36 By contrast, Th2 cells were higher in IG4 and lower in IG3, when compared to IG1 and IG2. Th1 and Th2 cells were negatively anticorrelated and correlated with a variety of additional immune and pathway signatures (Extended Data Figure 6D). Regulatory T cells were higher in IG3. Tumors in IG3 also exhibited lower scores for the DNA repair pathway signature. Within the IG1-IG3 tumors, scores for pathways involved in immune regulation, such as TGF-β signaling (Figure 5G), interferon alpha and gamma response, IL6-JAK-STAT3 and IL2-STAT5 (Extended Data Figure 6D), were positively correlated with the inflammatory response signature (Figure 5B); by contrast, scores for several metabolic pathways, such as glycolysis or the peroxisome, were negatively correlated (Figures 5G, S6C, S6D). Of note, we observed that genes encoding targets of immune checkpoint (IC) blockade, such as PDCD1 (PD-1), CD274 (PD-L1), CTLA4, HAVCR2 (TIM3) and LAG3, were overexpressed in IG3 and - to a lesser extent - IG4 tumors, suggesting that these patients might benefit from the use of immune checkpoint inhibitors (ICI). Our results were largely replicated using an independent cohort of 42 LARC samples profiled by TCGA (Extended Data Figure 7, Table S10).12 Taken globally, these data uncover a unique LARC tumor immune profile evident in the pre-treatment setting that could be used to better prognosticate rectal cancer patients and develop novel therapeutic strategies.
DISCUSSION
Genomic analyses of CRC have disproportionately focused on colon tumors, due in part to the difficulty obtaining untreated rectal samples. As an example, rectal cancers below the rectosigmoid junction account for only about one tenth of all the CRC patients profiled by TCGA.11,12 Furthermore, these tumors cannot be used to analyze genomic differences across rectal segments, since their precise location was not annotated. This is in stark contrast with the distinction between left-sided and right-sided colon cancer, which has been thoroughly studied.25,37 By focusing on anatomically verified and clinically annotated rectal tumors, our data brings forth a unique opportunity to investigate the role of genomics in the tumorigenesis of rectal cancer. Our results show that APC mutations are less frequent in tumors from the lower rectum. This provides a genomic basis for clinical differences that had traditionally been explained based on anatomical considerations alone. 38–42
Prediction of response to NAT for locally advanced rectal cancer is clinically relevant because it may help select patients for organ preservation. Our group had previously reported an association between KRAS mutations and lower CR rates, based on data that came predominantly from the TIMING trial, where most patients received CRT-CNCT. 9,43 By contrast, that association was not observed in the larger cohort of 290 patients described here, which contains a combination of patients treated with CRT-CNCT and INCT-CRT. In fact, KRAS mutants exhibited a borderline non-significant improved rate of CR among INCT-CRT patients. In terms of recurrence, KRAS mutations were associated with shorter DFS in patients treated with CRT-CNCT, but not in patients treated with INCT-CRT. This can be interpreted as KRAS status having treatment-specific predictive value and relating differently to outcomes depending on whether systemic chemotherapy is administered before or after chemoradiation. However, underlying differences in patient accrual (e.g., clinical trial vs. routine care), treatment guidelines (e.g., type and dosage of genotoxic agents) and choice of surgical vs. non-operative management could act as confounding factors - particularly since individual cohorts are largely non-overlapping in time (Figure 3B). Furthermore, elements such as the time interval between completion of NAT and surgery may also affect tumor response and patterns of recurrence.7,44,45 In order to robustly characterize the predictive and prognostic role of KRAS mutations, larger cohorts need to be analyzed, ideally within the context of prospective, randomized clinical trials.
The role of the tumor microenvironment, and specifically the immune infiltrate, in LARC response to NAT is highlighted by dMMR/MSI tumors, which are characterized by a high lymphocyte infiltrate and respond well to ICI. 46,47 However, recent clinical trials have failed to show a benefit of ICI in the general LARC population, which consists of ~95% pMMR/MSS tumors.48 Here, we have identified pMMR/MSS immune hot tumors with extensive immune infiltration and favorable outcomes. This is consistent with previous observations, such as those that led to the development of the “Immunoscore’’ assay as a measure of pan-cytotoxic lymphocyte densities in the tumor-associated stroma that can be used as a prognostic factor in non-metastatic CRC.49,50 A diagnostic biopsy-adapted version of this test has recently shown promise at predicting response to NAT in LARC patients and selecting candidates for organ preservation.50,51 Remarkably, the immune hot pMMR/MSS tumors in our cohort exhibit higher levels of cytotoxic lymphocytes and T cells, as well as expression of IC-related proteins, than the dMMR/MSI set. The fact that these immune hot tumors only accounted for ~8% of the pMMR/MSS cases may explain why IC blockade has overall not shown activity in pMMR/MSS patients. The distinct immune profile that we have described could be used to select pMMR/MSS patients for inclusion in future ICI trials. Future research may also involve novel therapeutic strategies to induce immune infiltration in IG1 and IG2 tumors.
Our data shows that overexpression of certain genes, such as IGF2 and L1CAM, correlates with poor outcomes in LARC. Elevated levels of IGF2 expression in CRC patients have been reported before,11 but our results associate them with decreased response to NAT in LARC for the first time. If validated in prospective cohorts, IGF2 inhibitors could be explored as a therapeutic strategy to elicit response in these patients.52 The association between L1CAM and increased metastatic potential and chemoresistance in CRC has been well characterized mechanistically and the use of L1CAM-inhibitory molecules has been proposed as a promising adjuvant treatment for surgically resectable early-stage disease.31 Our results emphasize the clinical relevance of L1CAM as a marker of poor response to NAT in LARC.
Our work has limitations. First, a majority of our samples were sequenced with targeted-exome panels; the use of broader sequencing platforms might yield valuable additional insights. Second, RNA was only available for a small subset of our patients. Finally, the results from our analysis of associations between genomic features and response to NAT need to be interpreted with caution and will need to be further investigated in future cohorts, as explained above. We anticipate that the molecular profiling of specimens collected through recently completed clinical trials (such as OPRA53, TNT48 and PROSPECT54) will be valuable to further explore this question.
In summary, we have presented a comprehensive genomic analysis of rectal cancer in a large cohort of patients with detailed clinicopathological annotations and we have highlighted clinically relevant associations between transcriptomic features, immunologic profiles, and treatment outcomes. All the genomic and clinical data generated is publicly available through the cBioPortal for Cancer Genomics 55,56 (https://www.cbioportal.org/study/summary?id=rectal_msk_2022). We hope that this data will become a valuable resource for the community and that our results will inform the design of future clinical trials that can reduce morbidity and improve survival for rectal cancer patients.
METHODS
Patients
We analyzed tumors from 738 patients across four core cohorts and 557 additional patients from three supplementary cohorts (Table S3). All patients in the core cohorts had a pathologic confirmed diagnosis of rectal adenocarcinoma with a distal tumor border within 12 cm of the anal verge. Local staging was performed by endorectal ultrasound and/or MRI, and patients were screened for metastatic disease with CT scan of the chest, abdomen and pelvis. Adequate tissue from pre-treatment endoscopic diagnostic biopsies was available to allow for DNA and RNA isolation for molecular analysis. All the patients in the three supplementary cohorts were sequenced with MSK-IMPACT as part of their routine management in the context of our multidisciplinary cohort. Patients in the MSK-Colon cohort had been analyzed and described in a previous publication. 25 The use of specimens for this study was approved by the Institutional Review Board (IRB) at MSK (protocols 06-107, 11-083, 12-201, 12-245 and 16-1181) and other participating institutions, and informed consent was obtained from all patients.
Treatment Regimens and Clinical and Pathologic Assessment
The ACOSOG Z6041 and TIMING trials have already been described and efficacy results reported 6,13. Briefly, patients treated in the ACOSOG Z6041 trial had ultrasound staged cT2N0 tumors treated with neoadjuvant chemoradiotherapy consisting of 50 Gy of radiation, capecitabine and oxaliplatin followed by local excision 13. LARC patients used for outcome analyses (n=346) had American Joint Committee on Cancer (AJCC) clinical stage II (T3-4, N0) or III (any T, N1-2) rectal adenocarcinoma. These patients received neoadjuvant chemoradiotherapy (CRT) with concurrent fluoropyrimidine-based chemotherapy. Patients from the TIMING trial received CRT followed by 0, 2, 4, or 6 cycles of FOLFOX before surgery 6. Patients treated at MSK generally received up to 8 cycles of FOLFOX prior to CRT. After completing neoadjuvant therapy, patients underwent total mesorectal excision (TME), but some patients who had excellent clinical response were offered a watch-and-wait (WW) strategy with the goal of achieving organ preservation. CR after neoadjuvant therapy was defined as either pathological complete response (pCR), which indicates the absence of cancer cells on histologic evaluation of the TME specimen, or a clinical complete response (cCR) sustained for at least 2 years. Only patients with at least 2 years of follow-up after NAT were used for analyses involving CR status. Patients with residual cancer cells in the TME specimen and those with tumor regrowth after WW were defined as having an incomplete response (iCR).
Tissue Collection and DNA/RNA extraction
Pre-treatment biopsies were obtained from all patients. Normal tissue controls were obtained from: a) the proximal resection margins of the surgical specimens for 151 patients or b) matched blood samples obtained at the time of biopsy for 172 patients. Somatic mutations in the remaining 62 patients were called using a set of pooled normal samples followed by manual review to remove potential artifacts and germline variants. All the specimens were stored as Formalin Fixed Paraffin Embedded (FFPE) blocks and ten slides of 10-micron thickness were cut per block. A pathologist reviewed the hematoxylin and eosin (H&E) slides of all the sections to confirm the boundaries of the malignant or normal epithelia. The areas with enriched tumor were marked under microscopy. Tumor tissues were micro-dissected from unstained slides guided by the marked H&E slides. DNA & RNA were simultaneously extracted from FFPE sections using AllPrep DNA/RNA FFPE kits (Qiagen Inc., Valencia, CA.)
Sample Sequencing and Tumor Profiling
A set of 692 tumors were sequenced using MSK-IMPACT, a capture-based next-generation sequencing platform that can detect mutations, copy number alterations, and select rearrangements in 341-505 cancer-associated genes, depending on the version of the panel (Table S1, S11). The MSK-IMPACT assay achieves high depth of sequencing (800x) and is performed in a Clinical Laboratory Improvement Amendments (CLIA)–certified molecular laboratory, as previously described.58 We performed WES of 97 tumors with enough available genomic material. Samples were sequenced using the WES pipeline from the Integrated Genomics Operation Core at MSK (Table S1). Tumor DNA was sequenced at a depth of 150x and DNA from adjacent non-cancer tissue was sequenced at a depth of 70x. Additionally, we analyzed RNA-Seq data from 114 tumors that had enough biological material for RNA extraction (Extended Data Figure 1A). Total RNA was used to generate libraries for mRNA deep sequencing using an adapted version of the Illumina v1.5 protocol optimizing for reaction volume, and sequenced using the Illumina HiSeq 2000 Platform (Illumina, San Diego, CA).
Genomic Analyses
For samples sequenced with MSK-IMPACT, somatic mutations and copy number alterations were called for each sample using published methods.59 All the alteration frequencies that we report were adjusted to account for the specific set of genes included in each version of the MSK-IMPACT panel by dividing by the number of samples for which a given gene was sequenced. All mutation calls made against pooled normals were manually reviewed to exclude potential germline alterations. Discrete copy number calls were verified using the expression data from the READ TCGA cohort. WES data was processed using the Time-Efficient Mutational Profiling in Oncology (TEMPO) platform developed at the Center for Molecular Oncology at MSK (https://ccstempo.netlify.app/). Tumor mutational burden was calculated as the number of nonsynonymous mutations per megabase sequenced. The fraction of genome altered (FGA) was defined as the fraction of log2 copy number variation (gain or loss) >0.2 divided by the size of the genome whose copy number was profiled. Analysis of copy number alterations was performed for both MSK-IMPACT and WES sequenced samples with available matched normals using the FACETS (Fraction and Allele-Specific Copy Number Estimates from Tumor Sequencing) algorithm60, which provides allele-specific copy number estimates at both the gene level and chromosome arm level. FACETS was also used to generate purity-corrected segmentation files and for detection of WGD events. Tumors were considered to have undergone WGD if greater than 50% of their autosomal genome had a major copy number (the more frequent allele in a given segment) greater than or equal to two.16 The FACETS-suite package (https://github.com/mskcc/facets-suite) was used to estimate cancer cell fractions (CCF) and infer the clonality of somatic mutations, assess arm-level copy-number changes and generate mutant allele copy-number estimates. Among patients sequenced with MSK-IMPACT, only patients from the MSK-C cohort were used for FACETS analyses, to ensure that every sample had a matched blood normal. Furthermore, 46 samples from the MSK-C cohort were excluded from these analyses because they failed FACETS quality control criteria. Biallelic inactivation was defined as loss of the wild-type allele through either multiple mutations or a mutation and loss of heterozygosity at the locus of interest. Allelic imbalance for KRAS was assessed using the mutant allele copy number estimates which were generated by the FACETS algorithm as described previously. 61 Samples in which the mutant allele copy number was greater than the wild-type allele copy number were considered to have undergone mutant allele selection. Mutations were considered to be subclonal when the upper bound of the 95% CI for the CCF was less than one and the probability of CCF < 0.5 was greater than 0.95, as estimated by FACETS.61 Microsatellite instability (MSI) status was established using MSIsensor62 with a score threshold ≥10, as justified in previous studies63. Mutational signatures were extracted using our own publicly available code (https://github.com/mskcc/tempoSig) and the dictionary of COSMIC v3 signatures developed by the Sanger Institute.64
Variant annotation.
Genomic alterations were annotated using the OncoKB precision oncology knowledge base,20 which identifies functionally relevant cancer variants and their potential clinical actionability. Variants of unknown significance (VUS) were defined as alterations not classified as oncogenic, likely oncogenic, or predicted oncogenic by OncoKB, and were excluded from our analyses - except where otherwise specified. Therapeutically targetable somatic alterations were labeled using levels of clinical actionability defined in OncoKB, which range from level 1, FDA-recognized biomarkers of response to FDA-approved drugs, to level 4, biomarkers of hypothetical relevance based on compelling preclinical biological evidence. APC mutations were split into N-terminal and C-terminal sites at amino acid 1400, as in previous analyses.15
Pathway analyses.
We evaluated somatic alterations (mutations and copy number changes) in 10 canonical signaling pathways using the templates provided in the signaling pathways manuscript from the TCGA PanCancer Atlas project.14 The pathways analyzed were cell cycle, Hippo, Myc, Notch, oxidative stress response/Nrf2, PI3K, receptor-tyrosine kinase (RTK)/RAS/MAPK, TGFβ, p53, and β-catenin/Wnt. A pathway was considered altered in a given tumor sample if at least one of the genes associated with it was altered. Statistical significance of differences in frequency was assessed using Fisher’s exact test.
Transcriptomic Analyses
Analyses of differential gene expression were conducted using DESeq2 v.1.30.165. Significant differences were required to exhibit |log2FoldChange| > 1 and False Discovery Rate (FDR) < 0.05 (unadjusted p-values were used for the validation results shown in Extended Data Figure 5I). The biomaRt v.2.46.3 package66 was used for gene annotation and volcano plots were generated using EnhancedVolcano v.1.8.0. The correlation plot shown in Extended Data Figure 6D was drawn using package corrplot v0.84 in R. Single sample gene set enrichment analysis (ssGSEA) was performed using the R package GSVA v1.38.2 67. Tumor classification into CMS groups was performed using the CMScaller package in R. 68 For the validation of immune profiles using TCGA rectal tumors (Extended Data Figure 7), we restricted our analyses to the set of stage II and III specimens with publicly available RNASeqV2 from the Illumina HiSeq platform and having CMS subtypes and MSI status curated in the TGCA pan-gastrointestinal manuscript (Table S10).12 We also used the ssGSEA scores for individual immune signatures published by the TCGA pan-immune group.69
Statistical Analyses
Comparisons between groups were done using two-sided Mann-Whitney U test for continuous variables and two-sided Fisher’s test for categorical variables. Multivariate logistic-regression models were used to evaluate associations between CR and specific clinical and genomic variables. Log-rank tests were used to compare disease free survival (DFS) for different groups in the univariate setting, while Cox proportional hazards were used for multivariate analyses of DFS. Unless otherwise specified, DFS was measured from the beginning of neoadjuvant therapy. All reported p-values are two-tailed. Multiple testing correction was applied when needed using either Bonferroni correction or the false discovery rate method. All analyses were performed using R v3.5.2 (www.R-project.org) and Bioconductor v3.4.
Immunofluorescence Staining
5 micron-thick FFPE slides were prepared for immunofluorescence (IF) staining of CD4 and CD3 at the Molecular Cytology Core Facility of Memorial Sloan Kettering Cancer Center using Discovery XT processor (Ventana Medical Systems. Roche-AZ). Rabbit monoclonal CD4 antibody (Ventana, cat#790-4423) was used as 1:5 prediluted dilution followed by incubation with biotinylated goat anti-rabbit IgG (5.75μg/mL) (Vector labs, cat#PK6101). Blocker D, Streptavidin- HRP and Tyramide-CF594 (Biotium, cat.#92174) were prepared according to manufacturer instruction. Rabbit polyclonal anti-CD3 primary antibody (Dako, cat#A0452) was used as 2.4 μg/ml concentration. This was followed by incubation with biotinylated goat anti-rabbit IgG (5.75ug/mL) (Vector labs, cat#PK6101). Streptavidin- HRP and CF543 (Biotium, cat#92172) were prepared according to manufacturer instruction. All slides were counterstained in 5μg/mL DAPI [dihydrochloride(2-(4-Amidinophenyl)-6-indolecarbamidine dihydrochloride] (Sigma, cat#D9542). Coverslides were applied after adding mounting medium Mowiol (Calbiochem cat#475904). IF slides were scanned on a P250 slide scanner (3DHistech, Budapest, Hungary) using a 20x/0.8NA objective. 3-4 regions of the tumor were annotated using 3DHistech’s CaseViewer software. Thresholds were applied per channel to screen out background signals. Signals above the threshold were quantified as the fraction of positive cells/total cells in the annotated area (0.2mm2) using ImageJ. The median value per slide was taken, and a Wilcoxon rank-sum test was performed for statistical analysis.
Quantification of tumor infiltrating lymphocytes
Abundance of TILs was quantified from H&E slides. Inter-tumoral TILs were identified as mononuclear immune cells in tumor associated stroma and measured as the percentage of stromal area occupied by immune cells,70 not counting desmoplasia/fibroblasts or neutrophils. Intra-Tumoral TILs were identified as lymphocytes in tumor nests having direct cell-to-cell contact with carcinoma cells.
DATA AVAILABILITY
All genomic results and associated clinical data for all patients in this study have been deposited in the cBioPortal for Cancer Genomics 55,56 and are publicly available for browsing and bulk download using this link: https://www.cbioportal.org/study/summary?id=rectal_msk_2022. The raw RNA-Seq data has also been deposited in GEO [accession number GSE209746 available at https://www.ncbi.nlm.nih.gov/geo/query/acc.cgi?acc=GSE209746]. The raw DNA sequencing data are protected; de-identified data are available under restricted access to protect patient privacy in accordance with federal and state law. These data can be requested for research use from the corresponding author. Data will be shared for a span of 2 years within 2 weeks of execution of a data transfer agreement with MSK, which will retain all title and rights to the data and results from their use. The OncoKB knowledgebase that we used to annotate genomic alterations is publicly available at https://www.oncokb.org/. TCGA data used for comparison is available via the Genomic Data Commons Portal: https://portal.gdc.cancer.gov/.
CODE AVAILABILITY
The mutational signature decomposition code can be found at https://github.com/mskcc/tempoSig. The OncoKB annotator tool is also available through its own Github repository at https://github.com/oncokb. Additional custom written tools and programs used for the analysis of MSK-IMPACT data are available through the MSK Github repository at https://github.com/mskcc.
Extended Data
Extended Data Fig. 1. Cohort overview and patient breakdown by analyses.
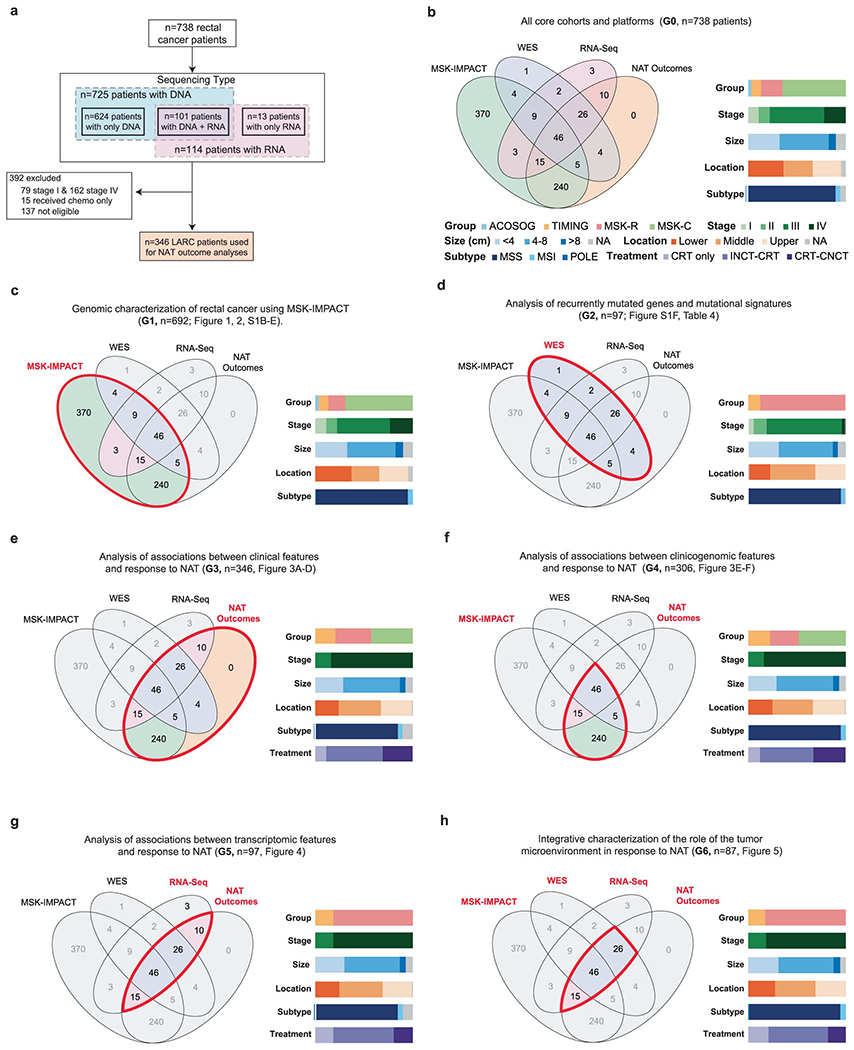
((A) Overview of the different sample sets used for the different analyses described in the manuscript, including sample sizes and reasons for exclusion. (B) Venn diagrams showing overlaps for patients with available MSK-IMPACT, WES, RNA-Seq and NAT outcome data. Color bars show the distribution of different relevant clinical variables. (C-H) Same as B, but restricted to the subset of patients used in specific analyses described in the manuscript. Thick red contours drawn on top of the Venn diagrams are used to highlight the set of patients used in each case. The G# in the titles refer to the columns found in Table S1.
Extended Data Fig. 2. Additional insights into the genomic landscape of rectal cancer.
(A) Overview of driver alterations in rectal cancer stratified by tumor stage. (B) Distribution of clonal vs. driver mutations for the most frequently mutated genes in our rectal cancer cohort. (C) Fraction of samples with two driver mutations in selected genes where both are clonal, both are subclonal or only one is clonal. (D) Distribution of KRAS mutations stratified by affected codon and specific amino acid change. Blue vertical bars show the fraction of clonal vs. subclonal mutations. Red and gray bars show the fraction of samples with allelic imbalance (mutant selection). (E) Distribution of mutational signatures for samples in the WES cohort. Samples were ordered from left to right in terms of decreasing SBS1 signature (mitotic clock) and stratified according to dMMR/MSI status.
Extended Data Fig. 3. Comparison of colon and rectal adenocarcinomas.
(A) Clinicopathological features for right colon, left colon, and rectum samples. (B) Differences in first site of metastasis stratified by primary tumor location. (C) TMB and FGA in pMMR/MSS tumors from the right colon (n=121), left colon (n=187), and rectum (n=449). Statistical significance was assessed using a two-sided Mann-Whitney U test. (D) Frequency of somatic alterations in oncogenic signaling pathways by anatomic location. Significant results were denoted as * indicating q <0.05, ** indicating q<0.01, *** indicating q<0.005, and **** indicating q<0.001. (E) Frequency of RAS/RAF alterations in hypermutated and non-hypermutated tumors stratified by tumor location. (F) Copy number profiles for tumors in the analyzed cohorts. (G) Frequency of copy number alterations affecting the p and q arms of chromosome 20 by anatomic location. (H) FGA as a function of TP53 status, stratified by missense vs. truncating and mono-allelic vs. biallelic inactivation, for tumors from the right colon (wild-type n=39, missense n=8, missense biallelic n=33, truncating n=1, truncating biallelic n=17), left colon (wild-type n=32, missense n=10, missense biallelic n=77, truncating n=5, truncating biallelic n=29) and rectum (wild-type n=73, missense n=44, missense biallelic n=175, truncating n=12, truncating biallelic n=81). (I) Fraction of dMMR/MSI tumors by rectal segment. (J) Distance to the anal verge by APC status in the validation cohort of metastatic patients. APC WT (n=43) were compared to APC altered (n=115) using a two-sided Mann-Whitney U test, * indicates p=0.0029. (K) Distribution of APC mutations by genomic location in tumors from the right colon, left colon, upper rectum, middle rectum, and lower rectum. In panels (B), (D) and (G), statistical significance was assessed using a two-sided Fisher’s exact test and p values were corrected for multiple testing using false discovery rate. In panels (C), (H) and (J), boxplots’ center lines indicate medians, edges indicate the interquartile range, and whiskers extend to the highest and lowest values not considered outliers.
Extended Data Fig. 4. Clinical and genomic determinants of response to NAT in LARC.
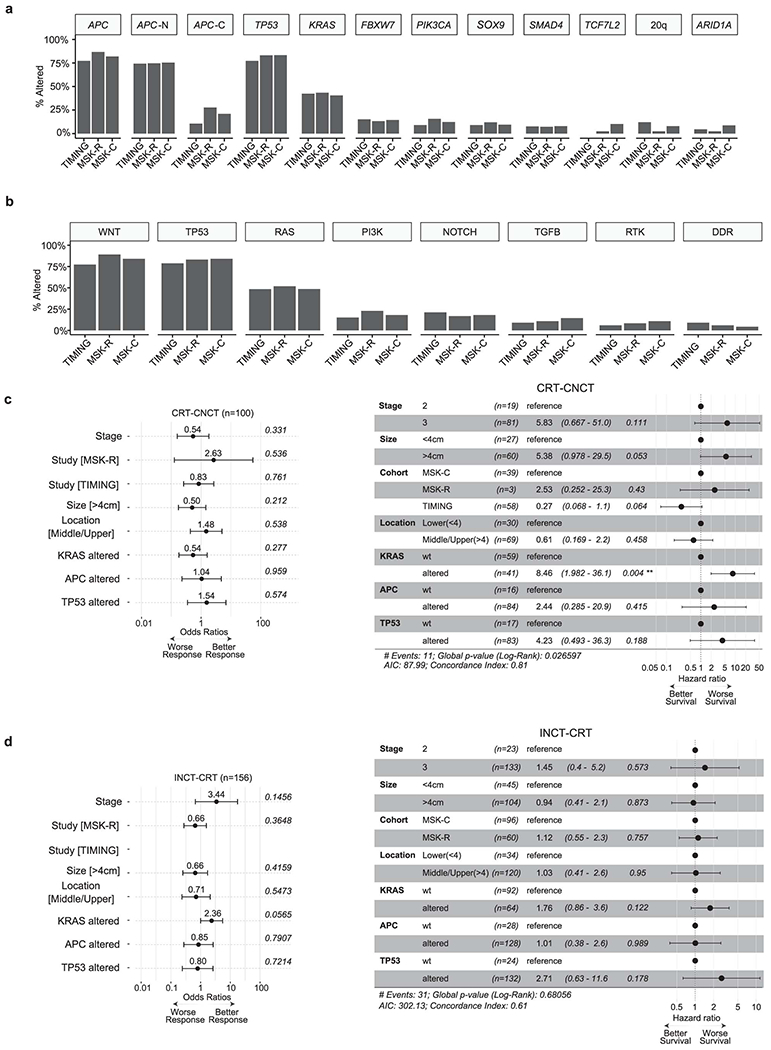
(A) Frequency of somatic alterations in rectal cancer driver genes for the patients used in our analyses of clinical outcomes, stratified by cohort. (B) Frequency of somatic alterations in oncogenic signaling pathways for the patients used in our analyses of clinical outcomes, stratified by cohort. (C) Left panel shows results from a multivariate analysis of associations between CR and a combination of clinicopathological and genomic features using a logistic regression model. The error bars indicate the 95% confidence interval. Right panel shows results from a multivariate analysis of associations between DFS and a combination of clinicopathological and genomic features using a Cox proportional hazards model. The results shown in this panel were obtained using patients treated with CRT-CNCT. (D) The left panel shows a multivariate analysis of associations between CR and a combination of clinicopathological and genomic features using a logistic regression model. The error bars indicate the 95% confidence interval. The right panel shows results from a multivariate analysis of associations between DFS and a combination of clinicopathological and genomic features using a Cox proportional hazards model. The results shown in this panel were obtained using patients treated with INC-CRT.
Extended Data Fig. 5. Stratification of rectal adenocarcinomas using the consensus molecular subtypes (CMS) classification.
(A) Expression levels for selected genes stratified by CMS group. Genes were annotated using the signatures from Budinska et al.57 (B) TMB stratified by CMS groups. Sample sizes are: CMS1 (n=11), CMS2 (n=26), CMS3 (n=26), and CMS4 (n=38). (C) FGA stratified by CMS groups. Sample sizes are: CMS1 (n=11), CMS2 (n=26), CMS3 (n=26), and CMS4 (n=38). (D) Percentage of KRAS mutated tumors by CMS group. (E) ssGSEA scores for selected pathways from the Hallmark dataset35. Sample sizes are: CMS1 (n=11), CMS2 (n=26), CMS3 (n=26), and CMS4 (n=38). (F) DFS for LARC patients treated with NAT, stratified by CMS group. (G) Levels of CA9 gene expression as a function of KRAS and PIK3CA mutational status. Double-mutants and KRAS-mutant tumors had significantly higher expression of CA9 compared to wild-type tumors, p=1.3e-07 and p=4.65e-05, respectively. Sample sizes are: Double-mutant (n=8), KRAS-mutant (n=26), PIK3CA-mutant (n=6), and wild-type (n=5). Statistical significance was assessed using a two-sided Mann-Whitney U test. (H) Expression of L1CAM stratified by CMS group. L1CAM expression was higher in CMS2 and CMS4 compared to CMS3, q=0.0498 and q=0.096, respectively. Sample sizes are: CMS1 (n=11), CMS2 (n=26), CMS3 (n=26), and CMS4 (n=38). (I) Validation of transcriptomic findings using an independent cohort of 15 LARC cases from Kamran et al.10 Differential gene expression was conducted using DESeq2 and the p-values attained by the Wald test were corrected using false discovery rates. In panels (B), (C), (E) and (H), statistical significance was assessed using a two-sided Mann-Whitney U test. P values were corrected using the Bonferroni method and significant results were denoted as * indicating q <0.05, ** indicating q<0.01, *** indicating q<0.005, and **** indicating q<0.001. In panels (B), (C), (E), (G), and (H), boxplots’ center lines indicate medians, edges indicate the interquartile range, and the whiskers extend to the highest and lowest values not considered outliers.
Extended Data Fig. 6. Supporting information for the characterization of immune hot pMMR/MSS LARC tumors with favorable outcomes from NAT.

(A) Quantification of intra-tumoral TILs from H&E slides for 20 patients, including cases from IG1 (n=6), IG2 (n=6), IG3 (n=5) and IG4 (n=3). Statistical significance was assessed using a two-sided Mann-Whitney U test. P values were corrected using the Bonferroni method. Boxplots’ center lines indicate medians, edges indicate the interquartile range, and the whiskers extend to the highest and lowest values not considered outliers. Right panel shows correlation between estimated fractions of intra-tumoral and inter-tumoral TILs. Statistical significance was assessed using a two-sided Spearman correlation. Error bands represent 95% confidence intervals. (B) ssGSEA scores for immune cell signatures from Bindea et al. 32. Displayed cell types are the ones with an adjusted p-value < 0.10 after Bonferroni correction, based on a Kruskal-Wallis test. (C) Comparison of ssGSEA scores for specific oncogenic pathway signatures from the Hallmark set 35 across the four immune clusters. Displayed cell types are the ones with an adjusted p-value < 0.10 after Bonferroni correction, based on a Kruskal-Wallis test. In panels (B) and (C), sample sizes are: IG1 (n=52), IG2 (n=37), IG3 (n=7), and IG4 (n=5). (D) Correlation plot showing gene signatures for 27 selected oncogenic pathways (yellow diamonds) and immune cell infiltrates (green diamonds). Right panels show illustrative scatter plots for pairs of variables with strong positive and negative correlations. White dots in the correlation heatmap highlight pairs of variables with significant two-sided Spearman correlation after Bonferroni correction. Error bands represent 95% confidence intervals. In panels (B) and (C), statistical significance was assessed using a two-sided Mann-Whitney U test. P values were corrected using the Bonferroni method and significant results were denoted as * indicating q <0.05, ** indicating q<0.01, *** indicating q<0.005, and **** indicating q<0.001. Boxplots’ center lines indicate medians, edges indicate the interquartile range, and the whiskers extend to the highest and lowest values not considered outliers.
Extended Data Fig. 7. Validation of immune groups in an independent cohort of LARC tumors from TCGA.
Validation of results using an idendepent cohort of 42 LARC samples from TCGA. (A) Unsupervised hierarchical clustering of pMMR/MSS tumors using ssGSEA scores for a set of well established immune signatures reveals three groups with increasing levels of overall immune infiltrate (IG1-IG3). dMMR/MSI tumors were added later as a fourth group (IG4). (B) Tumors in IG4 had higher TMB and had lower FGA than tumors in the IG1-IG3 groups. Sample sizes for each group are as follows: IG1 (n=16), IG2 (n=17), IG3 (n=7), and IG4 (n=2). Boxplots’ center lines indicate medians, edges indicate the interquartile range, and the whiskers extend to the highest and lowest values not considered outliers. (C) Distribution of CMS classes across immune groups. (D) Selected significant differences in ssGSEA scores for specific immune cell types across immune groups. Sample sizes for each group are as follows: IG1 (n=16), IG2 (n=17), IG3 (n=7), and IG4 (n=2). (E) Comparison of expression levels for genes encoding proteins involved in immune checkpoint blockade. Sample sizes for each group are as follows: IG1 (n=16), IG2 (n=17), IG3 (n=7), and IG4 (n=2). In panels (D) and (E), statistical significance was assessed using a two-sided Mann-Whitney U test. P values were corrected using the Bonferroni method and significant results were denoted as * indicating q <0.05, ** indicating q<0.01, *** indicating q<0.005, and **** indicating q<0.001. Boxplots’ center lines indicate medians, edges indicate the interquartile range, and the whiskers extend to the highest and lowest values not considered outliers.
Supplementary Material
Supplementary Tables 1,3.4,5,7,8,9,10,11
Table S1: Clinical, histopathological, and sequencing data.
Table S2: Summary of clinical characteristics for the full cohort.
Comparisons between groups were done using a two-sided Kruskal-Wallis test for continuous variables and a two-sided chi-square test for categorical variables.
Table S3: Overview of cohorts and key clinicopathological features.
Table S4: Summary of MutSigCV analysis using WES samples.
Table S5: Sample identifiers and clinical information for cases in supplemental cohorts.
Table S6: Summary of clinical characteristics for the treatment response cohort.
Comparisons between groups were done using a two-sided Kruskal-Wallis test for continuous variables and a two-sided chi-squared test for categorical variables.
Table S7: Summary of outcome analysis (response & DFS) using genomic data.
Associations between genomic variables and response were assessed using a Fisher’s-exact test in the univariate setting, while multivariate logistic regression models that adjusted for stage, tumor location, tumor size, and cohort were used for multivariate analyses. P-values were adjusted using the false-discovery rate method. Associations between genomic variables and DFS were assessed with log-rank tests in the univariate setting. Cox proportional hazards were used for multivariate analyses of DFS and were adjusted for alteration status (TP53, APC, KRAS),stage, tumor location, tumor size, and cohort. P-values were adjusted using the false-discovery rate method.
Table S8: Summary of outcome analysis (response & DFS) using transcriptomic data.
Associations between gene expression data and response were assessed with a differential gene expression analysis conducted using DESeq2. P-values computed using the Wald test were corrected for multiple testing using the false discovery rate method. Associations between gene expression and DFS were assessed with log-rank tests in the univariate setting. Cox proportional hazards were used for multivariate analyses of DFS and were adjusted for treatment type. P-values were adjusted using the false-discovery rate method.
Table S9: Results from TIL quantification analyses.
Table S10: Validation of immune profiling results using data from TCGA.
Table S11: List of genes on the MSK-IMPACT targeted sequencing panels.
ACKNOWLEDGMENTS
We acknowledge the use of services provided by the Molecular Cytology Core Facility, funded by the NCI Cancer Center Support Grant (CCSG, P30 CA008748-53). We also acknowledge the use of the Integrated Genomics Operation Core, funded by the NCI Cancer Center Support Grant (CCSG, P30 CA08748), Cycle for Survival, and the Marie-Josée and Henry R. Kravis Center for Molecular Oncology. W.K.C. is supported by a NIH research training grant (T32 GM132083). P.B.R. is supported by a NIH/NCI early career development award (K08 CA255574). J.J.S. is supported by a NIH/NCI R37 248289 award. The content is solely the responsibility of the authors and does not necessarily represent the official views of the National Institutes of Health. We thank Nicole Rusk of Memorial Sloan Kettering for editorial assistance.
COMPETING INTERESTS STATEMENT
D.N.K. has consulted for Merck Sharp & Dohme: Intellectual Property Rights. AbbVie and PsiOxus Therapeutics Ltd: Provision of Services. E.P.P. has received support from Intuitive Surgical. Q.S. reports consulting/advisory role from Yiviva, Boehringer Ingelheim Pharmaceuticals, Regeneron Pharmaceuticals, Hoosier Cancer Research Network (to self), Honorarium/speaker role from Chugai Pharmaceutical Co., stocks from Johnson & Johnson, Amgen, and Merck & CO. (to self), research funds from Celgene/BMS, Roche/Genentech, Janssen, Novartis (to institution). D.B.S. has consulted for and received honoraria from Pfizer, Lilly/Loxo Oncology, Vividion Therapeutics, Scorpion Therapeutics and BridgeBio. M.F.B. has consulted for Eli Lilly and PetDx, and has received research funding from Grail not related to the work presented. P.B.R. is a EMD Serono consultant and reports support for travel from Elekta and Philips healthcare and prior research funding from EMD Serono. R.Y. has performed advising for Pfizer, Mirati Therapeutics, and Natera, and she has received research support from Pfizer, Boehringer Ingelheim, and Forte Biosciences. J.J.S. has received travel support from Intuitive Surgical for fellow education and has served as a clinical advisor for Guardant Health. J.G.A. has received honorarium for being a consultant with Medtronics, Ethicon, Johnson & Johnson, Intuitive Surgical and owns stock in Intuitive Surgical. The remaining authors declare no competing interests.
REFERENCES
- 1.Siegel RL, Miller KD, Fuchs HE & Jemal A Cancer Statistics, 2021. CA Cancer J. Clin 71, 7–33 (2021). [DOI] [PubMed] [Google Scholar]
- 2.Saad El Din K et al. Trends in the epidemiology of young-onset colorectal cancer: a worldwide systematic review. BMC Cancer 20, 288 (2020). [DOI] [PMC free article] [PubMed] [Google Scholar]
- 3.Marr R et al. The modern abdominoperineal excision: the next challenge after total mesorectal excision. Ann. Surg 242, 74–82 (2005). [DOI] [PMC free article] [PubMed] [Google Scholar]
- 4.Smith JJ et al. Assessment of a Watch-and-Wait Strategy for Rectal Cancer in Patients With a Complete Response After Neoadjuvant Therapy. JAMA Oncol. 5, e185896 (2019). [DOI] [PMC free article] [PubMed] [Google Scholar]
- 5.Garcia-Aguilar J et al. Preliminary results of the organ preservation of rectal adenocarcinoma (OPRA) trial. JCO 38, 4008–4008 (2020). [Google Scholar]
- 6.Garcia-Aguilar J et al. Effect of adding mFOLFOX6 after neoadjuvant chemoradiation in locally advanced rectal cancer: a multicentre, phase 2 trial. Lancet Oncol. 16, 957–966 (2015). [DOI] [PMC free article] [PubMed] [Google Scholar]
- 7.Probst CP et al. Extended Intervals after Neoadjuvant Therapy in Locally Advanced Rectal Cancer: The Key to Improved Tumor Response and Potential Organ Preservation. J. Am. Coll. Surg 221, 430–440 (2015). [DOI] [PMC free article] [PubMed] [Google Scholar]
- 8.Garcia-Aguilar J et al. Identification of a biomarker profile associated with resistance to neoadjuvant chemoradiation therapy in rectal cancer. Ann. Surg 254, 486–92; discussion 492 (2011). [DOI] [PMC free article] [PubMed] [Google Scholar]
- 9.Chow OS et al. KRAS and Combined KRAS/TP53 Mutations in Locally Advanced Rectal Cancer are Independently Associated with Decreased Response to Neoadjuvant Therapy. Ann. Surg. Oncol 23, 2548–2555 (2016). [DOI] [PMC free article] [PubMed] [Google Scholar]
- 10.Kamran SC et al. Integrative molecular characterization of resistance to neoadjuvant chemoradiation in rectal cancer. Clin. Cancer Res 25, 5561–5571 (2019). [DOI] [PMC free article] [PubMed] [Google Scholar]
- 11.Cancer Genome Atlas Network. Comprehensive molecular characterization of human colon and rectal cancer. Nature 487, 330–337 (2012). [DOI] [PMC free article] [PubMed] [Google Scholar]
- 12.Liu Y et al. Comparative molecular analysis of gastrointestinal adenocarcinomas. Cancer Cell 33, 721–735.e8 (2018). [DOI] [PMC free article] [PubMed] [Google Scholar]
- 13.Garcia-Aguilar J et al. Organ preservation for clinical T2N0 distal rectal cancer using neoadjuvant chemoradiotherapy and local excision (ACOSOG Z6041): results of an open-label, single-arm, multi-institutional, phase 2 trial. Lancet Oncol. 16, 1537–1546 (2015). [DOI] [PMC free article] [PubMed] [Google Scholar]
- 14.Sanchez-Vega F et al. Oncogenic signaling pathways in the cancer genome atlas. Cell 173, 321–337.e10 (2018). [DOI] [PMC free article] [PubMed] [Google Scholar]
- 15.Mondaca S et al. Specific mutations in APC, but not alterations in DNA damage response, associate with outcomes of patients with metastatic colorectal cancer. Gastroenterology 159, 1975–1978.e4 (2020). [DOI] [PMC free article] [PubMed] [Google Scholar]
- 16.Bielski CM et al. Genome doubling shapes the evolution and prognosis of advanced cancers. Nat. Genet 50, 1189–1195 (2018). [DOI] [PMC free article] [PubMed] [Google Scholar]
- 17.Ciriello G et al. Emerging landscape of oncogenic signatures across human cancers. Nat. Genet 45, 1127–1133 (2013). [DOI] [PMC free article] [PubMed] [Google Scholar]
- 18.Taylor AM et al. Genomic and functional approaches to understanding cancer aneuploidy. Cancer Cell 33, 676–689.e3 (2018). [DOI] [PMC free article] [PubMed] [Google Scholar]
- 19.Lawrence MS et al. Mutational heterogeneity in cancer and the search for new cancer-associated genes. Nature 499, 214–218 (2013). [DOI] [PMC free article] [PubMed] [Google Scholar]
- 20.Chakravarty D et al. Oncokb: A precision oncology knowledge base. JCO Precis. Oncol 2017, (2017). [DOI] [PMC free article] [PubMed] [Google Scholar]
- 21.Infante JR et al. Safety, pharmacokinetic, pharmacodynamic, and efficacy data for the oral MEK inhibitor trametinib: a phase 1 dose-escalation trial. Lancet Oncol. 13, 773–781 (2012). [DOI] [PubMed] [Google Scholar]
- 22.Cleary JM et al. Differential Outcomes in Codon 12/13 and Codon 61 NRAS-Mutated Cancers in the Phase II NCI-MATCH Trial of Binimetinib in Patients with NRAS-Mutated Tumors. Clin. Cancer Res 27, 2996–3004 (2021). [DOI] [PMC free article] [PubMed] [Google Scholar]
- 23.Bendell JC et al. Phase I, dose-escalation study of BKM120, an oral pan-Class I PI3K inhibitor, in patients with advanced solid tumors. J. Clin. Oncol 30, 282–290 (2012). [DOI] [PubMed] [Google Scholar]
- 24.van Geel RMJM et al. A Phase Ib Dose-Escalation Study of Encorafenib and Cetuximab with or without Alpelisib in Metastatic BRAF-Mutant Colorectal Cancer. Cancer Discov. 7, 610–619 (2017). [DOI] [PMC free article] [PubMed] [Google Scholar]
- 25.Yaeger R et al. Clinical sequencing defines the genomic landscape of metastatic colorectal cancer. Cancer Cell 33, 125–136.e3 (2018). [DOI] [PMC free article] [PubMed] [Google Scholar]
- 26.Roxburgh CSD et al. Changes in the multidisciplinary management of rectal cancer from 2009 to 2015 and associated improvements in short-term outcomes. Colorectal Dis. 21, 1140–1150 (2019). [DOI] [PMC free article] [PubMed] [Google Scholar]
- 27.Cercek A et al. Mismatch Repair-Deficient Rectal Cancer and Resistance to Neoadjuvant Chemotherapy. Clin. Cancer Res. 26, 3271–3279 (2020). [DOI] [PMC free article] [PubMed] [Google Scholar]
- 28.Guinney J et al. The consensus molecular subtypes of colorectal cancer. Nat. Med 21, 1350–1356 (2015). [DOI] [PMC free article] [PubMed] [Google Scholar]
- 29.Korkeila E et al. Expression of carbonic anhydrase IX suggests poor outcome in rectal cancer. Br. J. Cancer 100, 874–880 (2009). [DOI] [PMC free article] [PubMed] [Google Scholar]
- 30.Lee-Kong SA et al. Hypoxia-related proteins in patients with rectal cancer undergoing neoadjuvant combined modality therapy. Dis. Colon Rectum 55, 990–995 (2012). [DOI] [PubMed] [Google Scholar]
- 31.Ganesh K et al. L1CAM defines the regenerative origin of metastasis-initiating cells in colorectal cancer. Nat. Cancer 1, 28–45 (2020). [DOI] [PMC free article] [PubMed] [Google Scholar]
- 32.Bindea G et al. Spatiotemporal dynamics of intratumoral immune cells reveal the immune landscape in human cancer. Immunity 39, 782–795 (2013). [DOI] [PubMed] [Google Scholar]
- 33.Davoli T, Uno H, Wooten EC & Elledge SJ Tumor aneuploidy correlates with markers of immune evasion and with reduced response to immunotherapy. Science 355, (2017). [DOI] [PMC free article] [PubMed] [Google Scholar]
- 34.Chen DS & Mellman I Oncology meets immunology: the cancer-immunity cycle. Immunity 39, 1–10 (2013). [DOI] [PubMed] [Google Scholar]
- 35.Liberzon A et al. The Molecular Signatures Database (MSigDB) hallmark gene set collection. Cell Syst. 1, 417–425 (2015). [DOI] [PMC free article] [PubMed] [Google Scholar]
- 36.Nishimura T et al. The critical role of Th1-dominant immunity in tumor immunology. Cancer Chemother. Pharmacol 46 Suppl, S52–61 (2000). [DOI] [PubMed] [Google Scholar]
- 37.Lee MS, Menter DG & Kopetz S Right versus left colon cancer biology: integrating the consensus molecular subtypes. J Natl Compr Canc Netw 15, 411–419 (2017). [DOI] [PubMed] [Google Scholar]
- 38.Νikolouzakis TK et al. Detailed and applied anatomy for improved rectal cancer treatment. Ann. Gastroenterol 32, 431–440 (2019). [DOI] [PMC free article] [PubMed] [Google Scholar]
- 39.Cheng L-J et al. Distinct Prognosis of High Versus Mid/Low Rectal Cancer: a Propensity Score-Matched Cohort Study. J. Gastrointest. Surg 23, 1474–1484 (2019). [DOI] [PubMed] [Google Scholar]
- 40.Yang H et al. Influence of tumor location on short- and long-term outcomes after laparoscopic surgery for rectal cancer: a propensity score matched cohort study. BMC Cancer 20, 761 (2020). [DOI] [PMC free article] [PubMed] [Google Scholar]
- 41.Nagtegaal ID et al. Low rectal cancer: a call for a change of approach in abdominoperineal resection. J. Clin. Oncol 23, 9257–9264 (2005). [DOI] [PubMed] [Google Scholar]
- 42.Patel SV et al. Distance to the anal verge is associated with pathologic complete response to neoadjuvant therapy in locally advanced rectal cancer. J. Surg. Oncol 114, 637–641 (2016). [DOI] [PMC free article] [PubMed] [Google Scholar]
- 43.Kim JK et al. KRAS mutant rectal cancer cells interact with surrounding fibroblasts to deplete the extracellular matrix. Mol. Oncol 15, 2766–2781 (2021). [DOI] [PMC free article] [PubMed] [Google Scholar]
- 44.Francois Y et al. Influence of the interval between preoperative radiation therapy and surgery on downstaging and on the rate of sphincter-sparing surgery for rectal cancer: the Lyon R90-01 randomized trial. J. Clin. Oncol 17, 2396 (1999). [DOI] [PubMed] [Google Scholar]
- 45.Moore HG et al. Rate of pathologic complete response with increased interval between preoperative combined modality therapy and rectal cancer resection. Dis. Colon Rectum 47, 279–286 (2004). [DOI] [PubMed] [Google Scholar]
- 46.Le DT et al. Mismatch repair deficiency predicts response of solid tumors to PD-1 blockade. Science 357, 409–413 (2017). [DOI] [PMC free article] [PubMed] [Google Scholar]
- 47.Ganesh K et al. Immunotherapy in colorectal cancer: rationale, challenges and potential. Nat. Rev. Gastroenterol. Hepatol 16, 361–375 (2019). [DOI] [PMC free article] [PubMed] [Google Scholar]
- 48.Rahma OE et al. Use of total neoadjuvant therapy for locally advanced rectal cancer: initial results from the pembrolizumab arm of a phase 2 randomized clinical trial. JAMA Oncol. 7, 1225–1230 (2021). [DOI] [PMC free article] [PubMed] [Google Scholar]
- 49.Pagès F et al. International validation of the consensus Immunoscore for the classification of colon cancer: a prognostic and accuracy study. Lancet 391, 2128–2139 (2018). [DOI] [PubMed] [Google Scholar]
- 50.El Sissy C et al. A Diagnostic Biopsy-Adapted Immunoscore Predicts Response to Neoadjuvant Treatment and Selects Patients with Rectal Cancer Eligible for a Watch-and-Wait Strategy. Clin. Cancer Res 26, 5198–5207 (2020). [DOI] [PubMed] [Google Scholar]
- 51.Kirilovsky A et al. The “Immunoscore” in rectal cancer: could we search quality beyond quantity of life? Oncotarget 13, 18–31 (2022). [DOI] [PMC free article] [PubMed] [Google Scholar]
- 52.Zanella ER et al. IGF2 is an actionable target that identifies a distinct subpopulation of colorectal cancer patients with marginal response to anti-EGFR therapies. Sci. Transl. Med 7, 272ra12 (2015). [DOI] [PubMed] [Google Scholar]
- 53.Smith JJ et al. Organ Preservation in Rectal Adenocarcinoma: a phase II randomized controlled trial evaluating 3-year disease-free survival in patients with locally advanced rectal cancer treated with chemoradiation plus induction or consolidation chemotherapy, and total mesorectal excision or nonoperative management. BMC Cancer 15, 767 (2015). [DOI] [PMC free article] [PubMed] [Google Scholar]
- 54.Schrag D et al. Challenges and solutions in the design and execution of the PROSPECT Phase II/III neoadjuvant rectal cancer trial (NCCTG N1048/Alliance). Clin. Trials 16, 165–175 (2019). [DOI] [PMC free article] [PubMed] [Google Scholar]
- 55.Cerami E et al. The cBio cancer genomics portal: an open platform for exploring multidimensional cancer genomics data. Cancer Discov. 2, 401–404 (2012). [DOI] [PMC free article] [PubMed] [Google Scholar]
- 56.Gao J et al. Integrative analysis of complex cancer genomics and clinical profiles using the cBioPortal. Sci. Signal 6, pl1 (2013). [DOI] [PMC free article] [PubMed] [Google Scholar]
- 57.Budinska E et al. Gene expression patterns unveil a new level of molecular heterogeneity in colorectal cancer. J. Pathol 231, 63–76 (2013). [DOI] [PMC free article] [PubMed] [Google Scholar]
- 58.Cheng DT et al. Memorial Sloan Kettering-Integrated Mutation Profiling of Actionable Cancer Targets (MSK-IMPACT): A Hybridization Capture-Based Next-Generation Sequencing Clinical Assay for Solid Tumor Molecular Oncology. J. Mol. Diagn 17, 251–264 (2015). [DOI] [PMC free article] [PubMed] [Google Scholar]
- 59.Zehir A et al. Mutational landscape of metastatic cancer revealed from prospective clinical sequencing of 10,000 patients. Nat. Med 23, 703–713 (2017). [DOI] [PMC free article] [PubMed] [Google Scholar]
- 60.Shen R & Seshan VE FACETS: allele-specific copy number and clonal heterogeneity analysis tool for high-throughput DNA sequencing. Nucleic Acids Res. 44, e131 (2016). [DOI] [PMC free article] [PubMed] [Google Scholar]
- 61.Bielski CM et al. Widespread selection for oncogenic mutant allele imbalance in cancer. Cancer Cell 34, 852–862.e4 (2018). [DOI] [PMC free article] [PubMed] [Google Scholar]
- 62.Niu B et al. MSIsensor: microsatellite instability detection using paired tumor-normal sequence data. Bioinformatics 30, 1015–1016 (2014). [DOI] [PMC free article] [PubMed] [Google Scholar]
- 63.Middha S et al. Reliable Pan-Cancer Microsatellite Instability Assessment by Using Targeted Next-Generation Sequencing Data. JCO Precis. Oncol 2017, (2017). [DOI] [PMC free article] [PubMed] [Google Scholar]
- 64.Alexandrov LB et al. The repertoire of mutational signatures in human cancer. Nature 578, 94–101 (2020). [DOI] [PMC free article] [PubMed] [Google Scholar]
- 65.Love MI, Huber W & Anders S Moderated estimation of fold change and dispersion for RNA-seq data with DESeq2. Genome Biol. 15, 550 (2014). [DOI] [PMC free article] [PubMed] [Google Scholar]
- 66.Durinck S, Spellman PT, Birney E & Huber W Mapping identifiers for the integration of genomic datasets with the R/Bioconductor package biomaRt. Nat. Protoc 4, 1184–1191 (2009). [DOI] [PMC free article] [PubMed] [Google Scholar]
- 67.Hänzelmann S, Castelo R & Guinney J GSVA: gene set variation analysis for microarray and RNA-seq data. BMC Bioinformatics 14, 7 (2013). [DOI] [PMC free article] [PubMed] [Google Scholar]
- 68.Eide PW, Bruun J, Lothe RA & Sveen A CMScaller: an R package for consensus molecular subtyping of colorectal cancer pre-clinical models. Sci. Rep 7, 16618 (2017). [DOI] [PMC free article] [PubMed] [Google Scholar]
- 69.Thorsson V et al. The immune landscape of cancer. Immunity 48, 812–830.e14 (2018). [DOI] [PMC free article] [PubMed] [Google Scholar]
- 70.Salgado R et al. The evaluation of tumor-infiltrating lymphocytes (TILs) in breast cancer: recommendations by an International TILs Working Group 2014. Ann. Oncol 26, 259–271 (2015). [DOI] [PMC free article] [PubMed] [Google Scholar]
Associated Data
This section collects any data citations, data availability statements, or supplementary materials included in this article.
Supplementary Materials
Supplementary Tables 1,3.4,5,7,8,9,10,11
Table S1: Clinical, histopathological, and sequencing data.
Table S2: Summary of clinical characteristics for the full cohort.
Comparisons between groups were done using a two-sided Kruskal-Wallis test for continuous variables and a two-sided chi-square test for categorical variables.
Table S3: Overview of cohorts and key clinicopathological features.
Table S4: Summary of MutSigCV analysis using WES samples.
Table S5: Sample identifiers and clinical information for cases in supplemental cohorts.
Table S6: Summary of clinical characteristics for the treatment response cohort.
Comparisons between groups were done using a two-sided Kruskal-Wallis test for continuous variables and a two-sided chi-squared test for categorical variables.
Table S7: Summary of outcome analysis (response & DFS) using genomic data.
Associations between genomic variables and response were assessed using a Fisher’s-exact test in the univariate setting, while multivariate logistic regression models that adjusted for stage, tumor location, tumor size, and cohort were used for multivariate analyses. P-values were adjusted using the false-discovery rate method. Associations between genomic variables and DFS were assessed with log-rank tests in the univariate setting. Cox proportional hazards were used for multivariate analyses of DFS and were adjusted for alteration status (TP53, APC, KRAS),stage, tumor location, tumor size, and cohort. P-values were adjusted using the false-discovery rate method.
Table S8: Summary of outcome analysis (response & DFS) using transcriptomic data.
Associations between gene expression data and response were assessed with a differential gene expression analysis conducted using DESeq2. P-values computed using the Wald test were corrected for multiple testing using the false discovery rate method. Associations between gene expression and DFS were assessed with log-rank tests in the univariate setting. Cox proportional hazards were used for multivariate analyses of DFS and were adjusted for treatment type. P-values were adjusted using the false-discovery rate method.
Table S9: Results from TIL quantification analyses.
Table S10: Validation of immune profiling results using data from TCGA.
Table S11: List of genes on the MSK-IMPACT targeted sequencing panels.
Data Availability Statement
All genomic results and associated clinical data for all patients in this study have been deposited in the cBioPortal for Cancer Genomics 55,56 and are publicly available for browsing and bulk download using this link: https://www.cbioportal.org/study/summary?id=rectal_msk_2022. The raw RNA-Seq data has also been deposited in GEO [accession number GSE209746 available at https://www.ncbi.nlm.nih.gov/geo/query/acc.cgi?acc=GSE209746]. The raw DNA sequencing data are protected; de-identified data are available under restricted access to protect patient privacy in accordance with federal and state law. These data can be requested for research use from the corresponding author. Data will be shared for a span of 2 years within 2 weeks of execution of a data transfer agreement with MSK, which will retain all title and rights to the data and results from their use. The OncoKB knowledgebase that we used to annotate genomic alterations is publicly available at https://www.oncokb.org/. TCGA data used for comparison is available via the Genomic Data Commons Portal: https://portal.gdc.cancer.gov/.