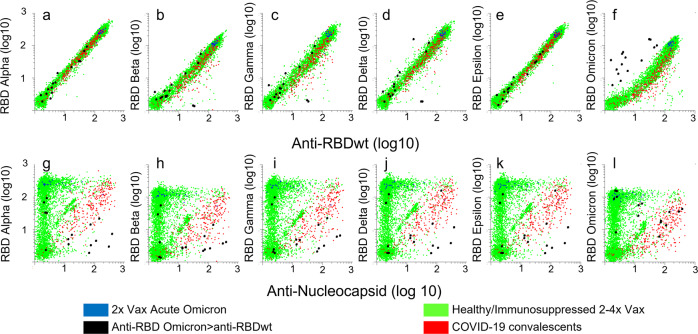
Fig. 2. Correlation between levels of antibodies to RBDs from SARS-CoV-2 variants.
The dot plots show accumulated data from array-based measurement of 6693 samples. Each dot in the scatter plots correspond to a different sample. Bead-based arrays were incubated with 6693 sera diluted 1:1000 for 1 h prior to labeling with R-Phycoerythrin-conjugated anti-Human IgG. a–f The x-axes show median fluorescence intensity (MFI) of anti-human IgG binding to beads coupled with RBDwt divided by MFI measured for beads with no virus protein (relative MFI, rMFI). The y-axes show anti-human IgG rMFI measured for beads coupled with RBDs from indicated variants. g–l The y-axes are the same as in dot plots (a–f), while the x-axis shows rMFI for antibodies binding to beads coupled with nucleocapsid from SARS-CoV-2wt. Green dots: post-vaccine sera, red dots: sera obtained in 2020 from SARS-CoV-2 convalescents. Blue dots: sera obtained 10–20 days after symptom debut of Omicron BA.1 infection in double-vaccinated healthy individuals. Source data are provided as a Source Data file.

