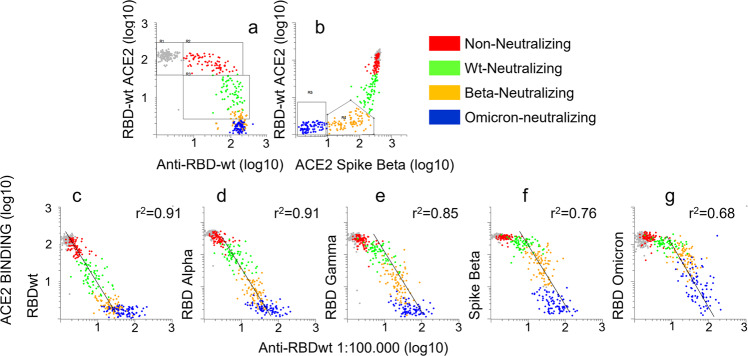
Fig. 6. Inhibitory effects of RBD-ACE2 interactions correlate with anti-RBDwt titers.
a, b See legend to Fig. 5a, b. Each dot in the scatter plots correspond to a different sample. c–g The x-axes show binding of human IgG to RBDwt after incubation with serum diluted 1:100,000. The y-axes show binding of ACE2 to beads coupled with RBDs and spike proteins from indicated SARS-CoV-2 variant after incubation with serum diluted 1:100. The dot plots show accumulated data from array-based analysis of 550 sera. Each dot corresponds to a different sample. Pearson correlation coefficients were determined for log-10 transformed data. Source data are provided as a Source Data file.

