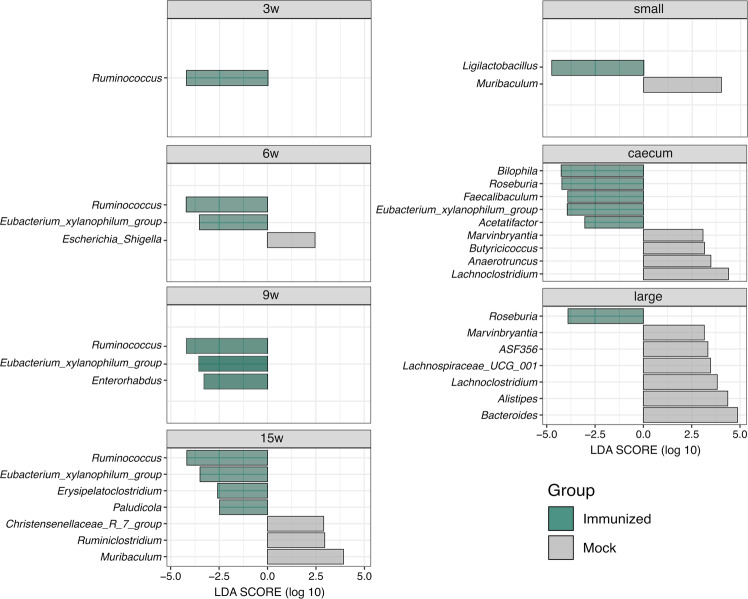
Fig. 3. Discriminative genera between HTI- and PBS-immunized mice following vaccination.
LEfSe analysis comparing the relative abundance of bacterial genera between Immunized and Mock groups during vaccine administration (pooled fecal samples at 3 week, 9 week, 6 week and 15 week) and at end of study at week 15 for individual fecal samples from small intestine, caecum and large intestine. Horizontal bars represent the effect size for each discriminant genus (p < 0.05 and LDA scores > 2.0). The bar length represents the log10 transformed LDA score, indicated by vertical lines.

