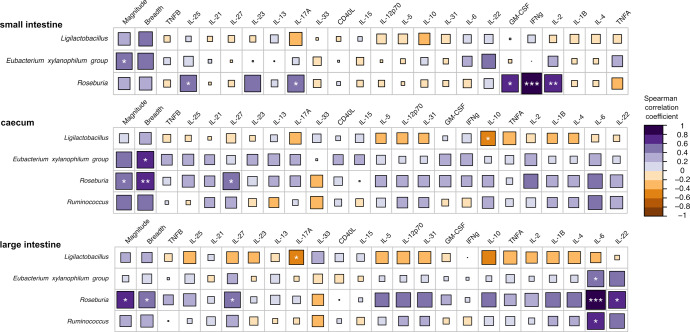
Fig. 4. Correlation analysis between discriminant bacteria, serum cytokines and immunological responses at the last time point of the study.
Spearman rank correlations between bacterial genera (only bacteria longitudinally enriched in HTI-immunized mice were evaluated), HTI immunogenicity (magnitude and breadth of the response) and serum cytokine levels. Associations are assessed for each gut section (small intestine, caecum and large intestine). Cytokines for each gut section are ordered based on unsupervised hierarchical clustering. Color and size of the square represent the magnitude of the correlation. Significance is indicated by white asterisks (*p < 0.05; **p < 0.01; ***p < 0.001 after Benjamini–Hochberg adjustment for multiple comparisons).

