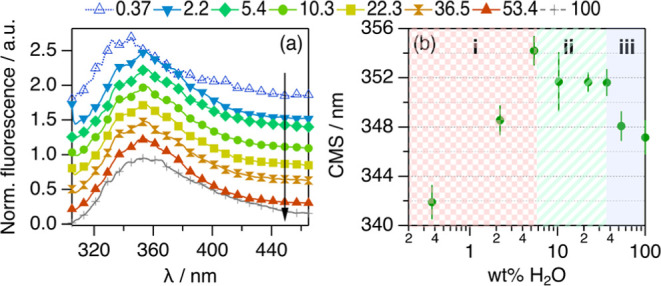
Figure 5.

(a) Trp emission spectra from 10 μM BSA in 1:2:n ChCl:Glyc:H2O at different hydration levels expressed in wt % H2O in the solvent. The data and results for BSA aqueous buffer (100 wt % H2O) are presented for comparison. Data in (a) have been offset for clarity by +0 (100 wt % H2O), +0.25, +0.50, +0.75, +1.00, +1.25, +1.50, and +1.75 (0.37 wt % H2O). Hydration increases in the direction of the arrows. (b) CSM results derived from the analysis of the Trp emission spectra between 305 and 380 nm.
