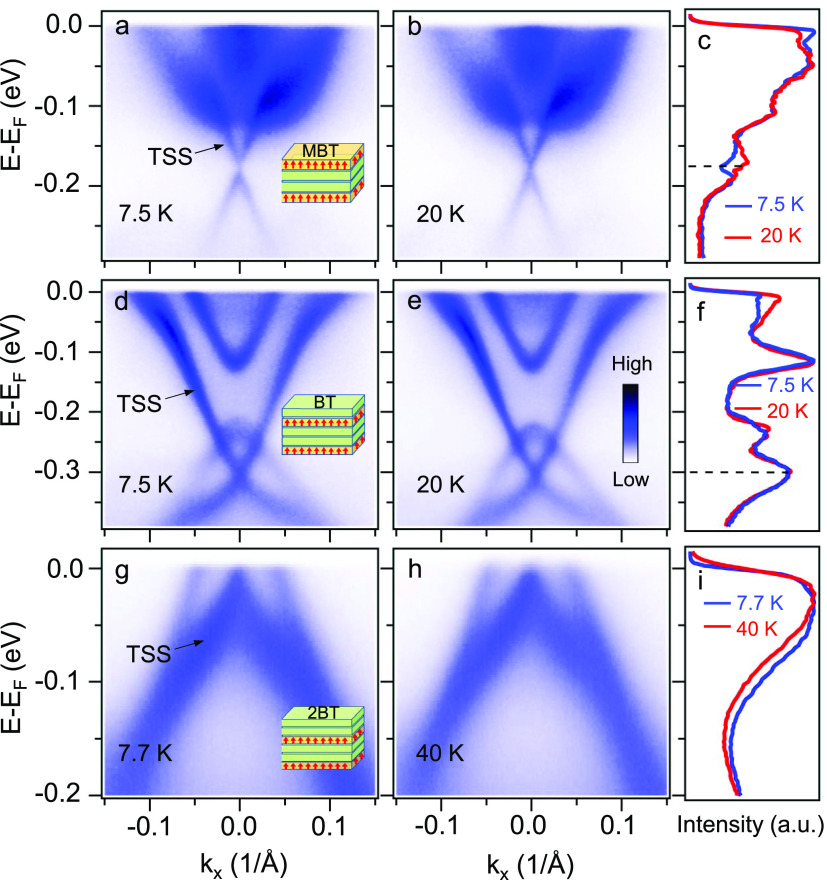
Figure 2.
Electronic structure of ferromagnetic MnBi6Te10. Energy-momentum spectra along Γ̅ – Μ̅ at (a) 7.5 K, and (b) 20 K. The insert in (a) illustrates the MnBi2Te4 (MBT) termination. (c) Comparison of energy distribution curves at Γ̅ . An energy gap is observed at the Dirac point (black dashed line) at 7.5 K. The counterpart results for the 1-Bi2Te3 (1-BT) termination are plotted in (d–f): (d,e) energy-momentum spectra, and (f) energy distribution curves at Γ̅ . The counterpart results for the 2-Bi2Te3 (2-BT) termination are plotted in (g–i): (g,h) energy-momentum spectra, and (i) energy distribution curves at Γ̅ .

