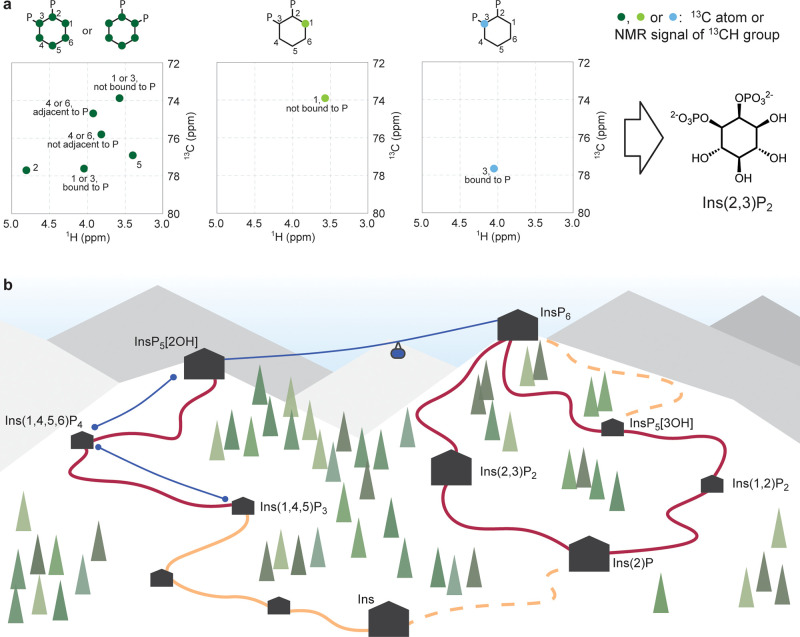
Figure 1.
(a) Use of asymmetrically labeled inositol metabolites to assign the structure of Ins(2,3)P2. For fully labeled [13C6]Ins(1/3,2)P2, it cannot be determined whether the phosphate group is in position 1 or 3 due to the symmetry. For 1[13C]Ins(1/3,2)P2, the signal of C1 is observed at the shift corresponding to the unphosphorylated form, whereas for 3[13C]Ins(1/3,2)P2, the signal of C3 is observed at the shift corresponding to the phosphorylated form. Therefore, the structure can be assigned as Ins(2,3)P2. (b) Cartoon representation of the metabolite network of InsPs (black huts; large huts represent metabolites quantified in various cell lines). Phosphorylation reactions catalyzed by known kinases are represented by blue lines (ski lifts). Dephosphorylation reactions catalyzed by MINPP1 are represented as dark red curved lines (slopes), dephosphorylations catalyzed by other phosphatases as orange curved lines (slopes), and dephosphorylations via uncharacterized pathways are represented as dashed curved lines (slopes). Trees and curvature of slopes are for artistic purposes only.

