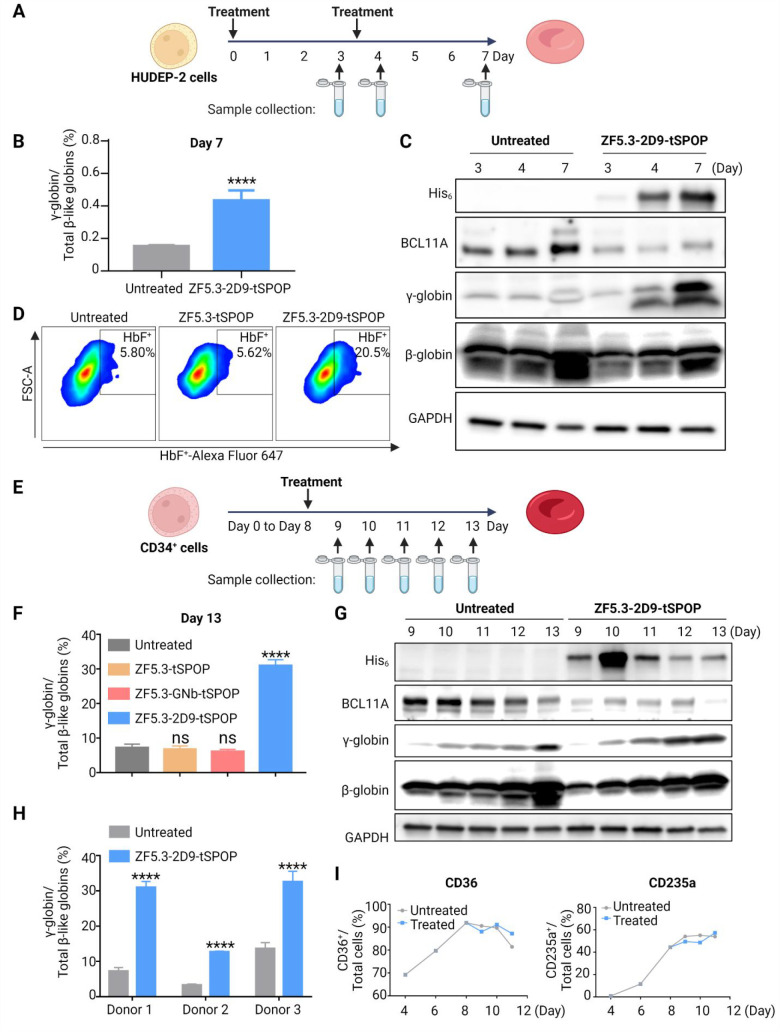
Figure 5.
HbF induction in HUDEP-2 and CD34+ cells. (A) Schematic depiction of the HUDEP-2 cells differentiation and treatment. (B) qRT-PCR showing an increase in γ-globin mRNA after treatment with ZF5.3-2D9-tSPOP in HUDEP-2 cells (mean ± SD, n = 3, ****P < 0.0001). (C) Immunoblot revealing the loss of BCL11A and γ-globin increase after treatment with ZF5.3-2D9-tSPOP in HUDEP-2 cells. (D) Representative flow cytometric analysis of immunostained HUDEP-2 cells from Day 7 of differentiation showing an increase in the population of HbF+ cells following the degradation of BCL11A (n = 2). (E) Schematic depiction of the CD34+ cell differentiation and treatment. (F) qRT-PCR showing an increase of the γ-globin mRNA level after treatment with ZF5.3-2D9-tSPOP but not ZF5.3-tSPOP or ZF5.3-GNb-tSPOP in CD34+ cells (mean ± SD, n = 3, ****p < 0.0001). (G) Immunoblots revealing the loss of BCL11A and γ-globin increase after treatment with ZF5.3-2D9-tSPOP in CD34+ cells. GAPDH was used as a loading control in all immunoblots. (H) qRT-PCR showing an increase of γ-globin mRNA levels in CD34+ cells from three different donors after treatment with ZF5.3-2D9-tSPOP (mean ± SD, n = 3, ****p < 0.0001). (I) The population of CD36+ and CD235a+ in differentiating CD34+ cells treated with or without ZF5.3-2D9-tSPOP; two repeats in cells from different donors were performed.

