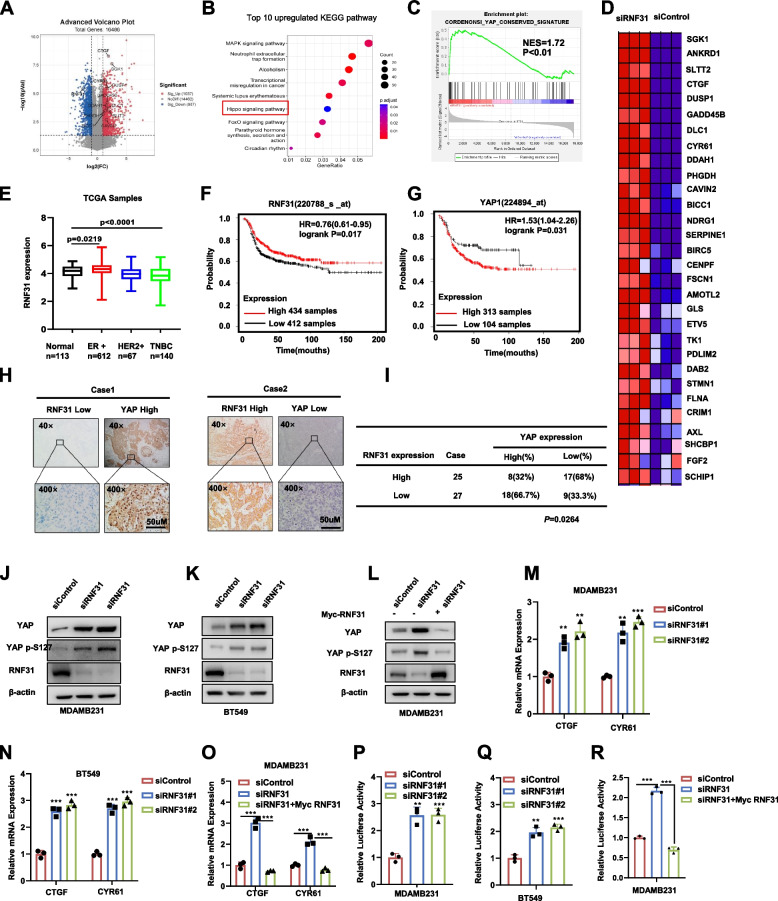
Fig. 2.
RNA sequence and clinical data analysis reveals the link between RNF31 and Hippo pathway in TNBC. A Volcano map of RNA-seq data from MDAMB231 cell lines treated with siControl or siRNF31. The volcanic map analysis showed that CTGF、CYR61 SGK1.et genes downstream of YAP were significantly up regulated in the RNF31 depletion group. Threshold P < 0.05 and fold change> 2 is set as screening criteria. B Top 10 KEGG pathway enriched by differentially up-regulated genes in RNA-seq data of RNF31 depletion group. Threshold P < 0.05. C Gene set enrichment analysis (GSEA) of RNA-seq data from MDAMB231 cell lines treated with siControl or siRNF31. The gene sets of CORDENONSI YAP CONSERVED SIGNATURE were enriched in the RNF31 depletion group. Threshold P < 0.05. D Heatmap of YAP related genes in RNA-seq data from MDAMB231 cell lines treated with siControl or siRNF31. Threshold P < 0.05 and fold change> 1.5. E The expression distribution of RNF31 in Luminal A, Luminal B, HER2 positive and TNBC tissues and normal tissues from TCGA database (https://tcga-data.nci.nih.gov). F-G Kaplan-Meier map of progression free survival of RNF31 and YAP in triple negative breast cancer patient. (http://kmplot.com/analysis/). H-I Immunohistochemistry (IHC) detecting RNF31 and YAP expression in TNBC tissues. Scale bar 50 μm. Chi-square test to detect of RNF31 correlation with YAP in 52 TNBC tumor samples (I). J-L Western blot results displaying the protein level of YAP, YAP P-S127 and RNF31 in cell lines transfected with either indicated treatment. M-O RT–qPCR results of CTGF and CYR61 mRNA expression in cell lines transfected with either indicated treatment. P-R Measurement of TEAD transcriptional activity in cells using luciferase assays using reporters that contain tandem TEAD binding sites. The results are representative of 3 independent experiments in panel J-R. β-actin was engineered to the internal reference for Western blot. The data are presented as mean ± SDs. **P < 0.01, ***P < 0.001 (Student’s t test)

