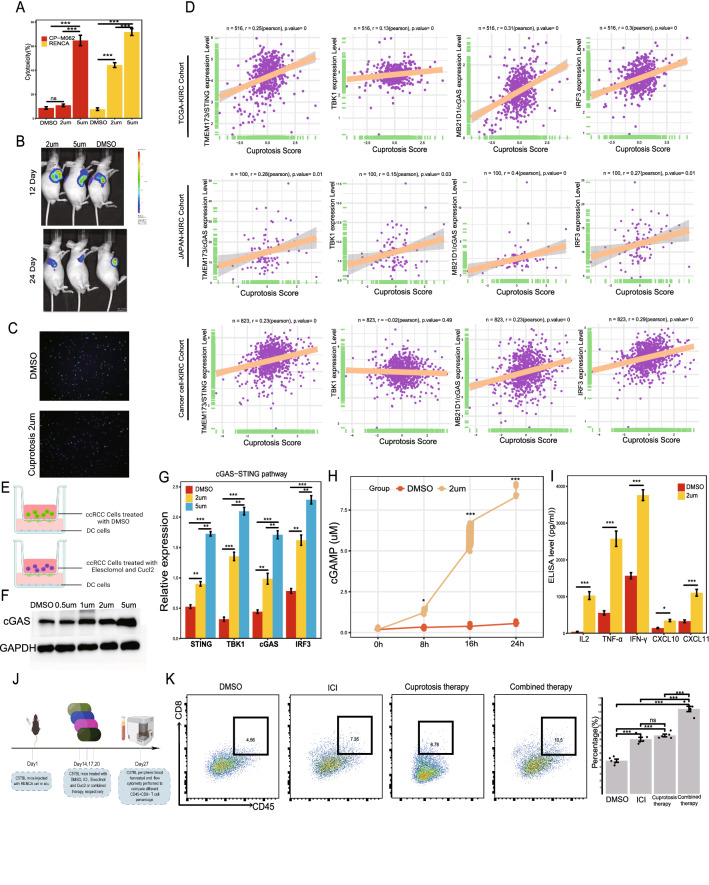
Fig. 13.
Activation of cuprotosis enhances ccRCC tumor immunity. A The Cell cytotoxicity was measured by lactate dehydrogenase (LDH) release assay after DMSO, elesclomol and Cucl2 for 48 h between CP-M062 and RENCA, to identify optimal concentration of cuprotosis inducer agent. B Tumor-bearing mice were treated with DMSO or elesclomol and Cucl2, and the total fluorescence intensity of each mouse model was recorded. C Comparison of the proportion of EdU positive cells in RENCA treated with DMSO or elesclomol and Cucl2. D Correlation between the cuprotosis score and cGAS-STING signature related genes expression level. E Schematic diagram of the coculture system of tumor and DC cells. F Different cGAS expression levels of DCs cells after cocultured with tumor cells pre-treated with different concentration level of elesclomol and Cucl2. G Expression levels of cGAS-STING signatures of DCs harvested from co-culture system were measured by qRT‑PCR. H Different cGAMP level from medium supernatant of co-culture system with tumor cell pre-treated with DMSO or elesclomol and Cucl2. I The IL-2, TNF-α, IFN-γ, CXCL10 and CXCL11 protein levels in the coculture medium supernatant were measured by ELISA after 48 h of coculture. J Schematic diagram of flow cytometry. K Representative flow cytometry plots of the percentage of CD45+CD8+ T cells from peripheral blood from different mice groups treated with DMSO, anti-PD-1mAB, cuprotosis inducer reagents, and combined therapy (anti-PD-1 + cuprotosis inducer reagents) by intraperitoneal, respectively. 2 μM, 5 μM: elesclomol and Cucl2 at 2 and 5 μmol/L. *P < 0.05, **P < 0.01, ***P < 0.001, ns: no significance

