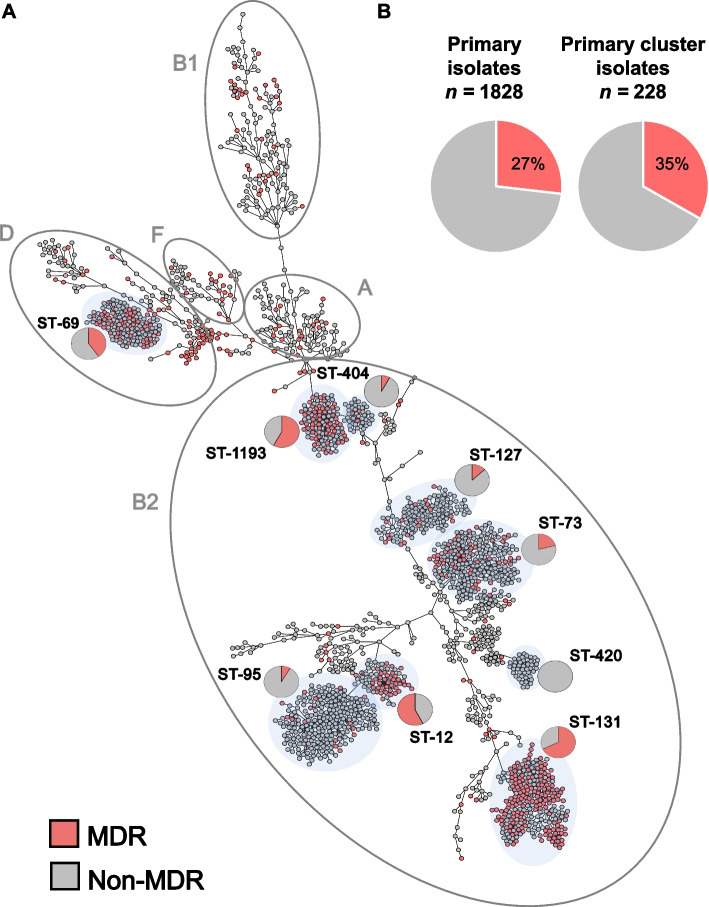
Fig. 1.
Population structure of a complete collection of E. coli clinical isolates for a 1-year period at a US hospital. A cgMLST-based minimum spanning tree of 2075 E. coli isolates. Isolates belonging to the main phylogenetic groups observed in this study are circled and labeled. The dominant STs are shaded in light gray and the proportion of MDR (red) and non-MDR (gray) isolates within specific STs is indicated by pie charts. B Pie charts indicate the prevalence of MDR (red) primary isolates (27%) was similar to the prevalence of MDR isolates in primary isolates predicted to be part of clusters of transmission (35%) (Table 1)

