Figure 1.
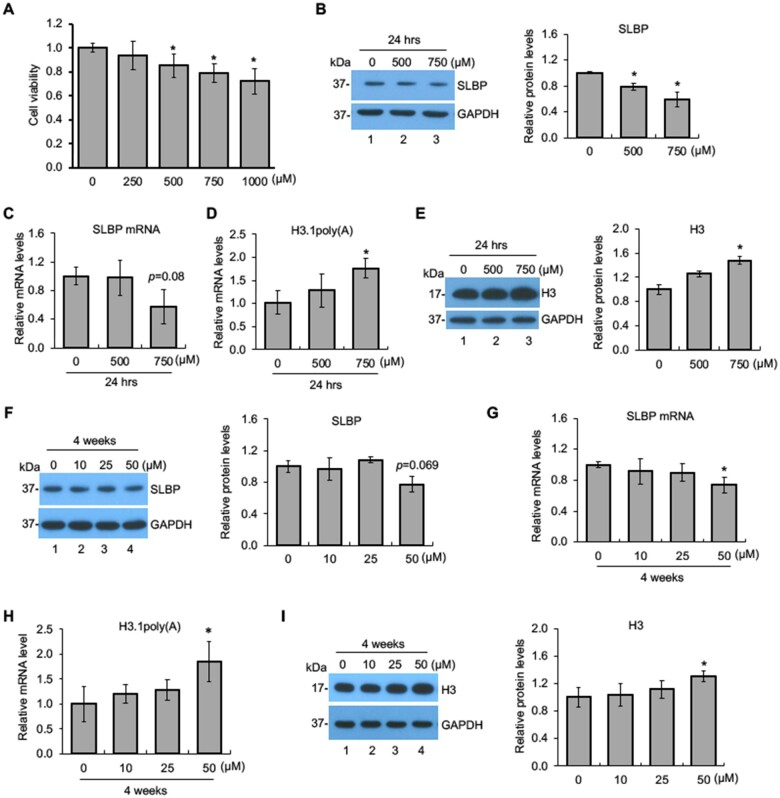
Downregulation of SLBP and polyadenylation of H3.1 mRNA by nicotine. A, BEAS-2B cells were treated with various concentrations of nicotine for 24 h and subjected to MTT assays. B and C, Downregulation of SLBP by nicotine. The SLBP protein level and mRNA level were measured by Western blot (B) and RT-qPCR (C), respectively, in BEAS-2B cells treated with or without nicotine for 24 h. GAPDH was used as an internal control. The band intensities (left panel in B) were quantified using ImageJ software and presented as bar graphs to show relative quantification of SLBP protein level (right panel in B). D and E, Polyadenylation of canonical histone H3.1 mRNA by nicotine. The level of polyadenylated H3.1 mRNA (F) and total H3 protein level (G) were determined by RT-qPCR and Western blot, respectively, in BEAS-2B cells treated with or without nicotine for 24 h. The amount of polyadenylated H3.1 mRNA was measured by RT-qPCR using cDNAs synthesized with oligo (dT) primers, capturing polyadenylated mRNAs. GAPDH was used as an internal control. The band intensities (left panel in G) were quantified and presented as bar graphs (right panel in G). F and G, Downregulation of SLBP by low-dose “long-term” treatment with nicotine. The SLBP protein and mRNA levels were measured by Western blot (D) and RT-qPCR (E), respectively, in BEAS-2B cells treated with (10, 25, and 50 μM) or without nicotine for 4 weeks. GAPDH was used as an internal control. The band intensities (left panel in D) were quantified and presented as bar graphs (right panel in D). H and I, Polyadenylation of canonical histone H3.1 mRNA by low-dose “long-term” treatment with nicotine. The level of polyadenylated H3.1 mRNA (H) and total H3 protein level (I) were determined by RT-qPCR and Western blot, respectively, in BEAS-2B cells treated with (10, 25, and 50 μM) or without nicotine for 4 weeks. GAPDH was used as an internal control. The band intensities (left panel in I) were quantified and presented as bar graphs (right panel in I). Untreated controls were used as references, which were set to 1. The data shown are the mean ± SD (n = 3). *p < .05 versus untreated control group.

