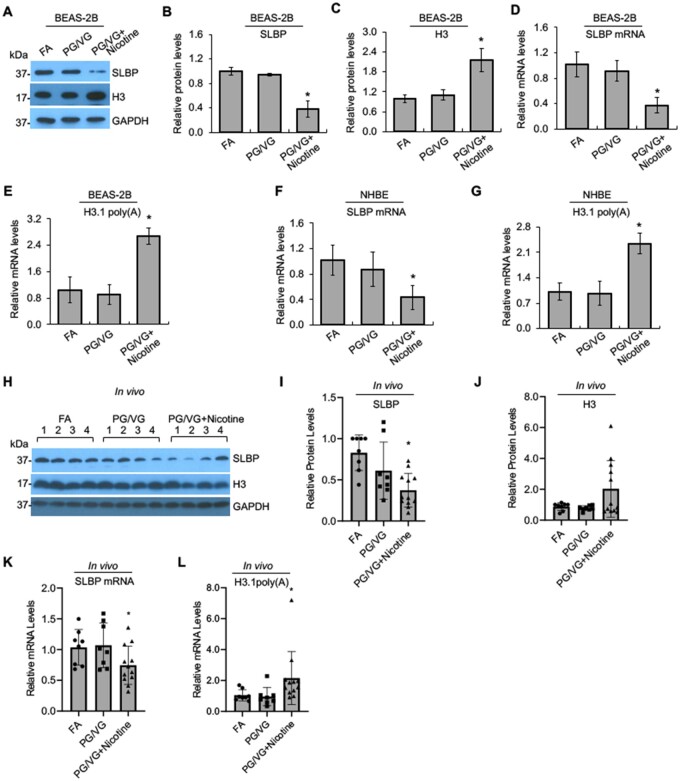
Figure 8.
Downregulation of SLBP and polyadenylation of H3.1 mRNA by e-cig aerosols with nicotine in human lung primary cells and in mice. A–C, Western blot detects changes in SLBP and H3 protein levels induced by e-cig aerosols in BEAS-2B cells. BEAS-2B ells were exposed to filtered clean air (FA), e-cig aerosols containing PG/VG and 0 mg/ml nicotine (PG/VG), or e-cig aerosols containing PG/VG and 18 mg/ml nicotine (PG/VG+Nicotine) followed by Western blot analysis. The band intensities were quantified using ImageJ software and presented as bar graphs to show relative quantifications of SLBP (B) and total H3 (C). GAPDH was used as an internal control. The FA control group were used as references. The data shown are the mean ± SD (n = 3). *p < .05 versus FA group. D and E: RT-qPCR detects changes in SLBP mRNA and polyadenylated H3.1 mRNA levels induced by e-cig aerosols in BEAS-2B cells. The amount of polyadenylated H3.1 mRNA was measured by RT-qPCR using cDNAs synthesized with oligo (dT) primers. mRNA levels for SLBP and H3.1 were normalized to GAPDH. The data shown are the mean ± SD (n = 3). *p < .05 versus FA group. F and G, Changes in SLBP mRNA and polyadenylated H3.1 mRNA levels induced by e-cig aerosols in NHBE primary cells. mRNA levels for SLBP and polyadenylated H3.1 were normalized to GAPDH. The data shown are the mean ± SD (n = 3). *p < .05 versus FA group. H–L, Western blot detects changes in SLBP and H3 levels in lung tissues of mice exposed to e-cig aerosols. A/J female mice were exposed FA, PG/VG, or PG/VG plus 36 mg/ml of nicotine 5 days a week for 3 months. Lung tissues were collected and protein and mRNA levels were analyzed by Western blot (H–J) or RT-qPCR (K, L), respectively. GAPDH was used as an internal control. The data are shown for each individual mouse. Relative protein levels were calculated based on band intensity. Error bars represent SD (n = 8 for FA and PG/VG groups; n = 12 for nicotine exposure group). *p < .05 versus FA group.

