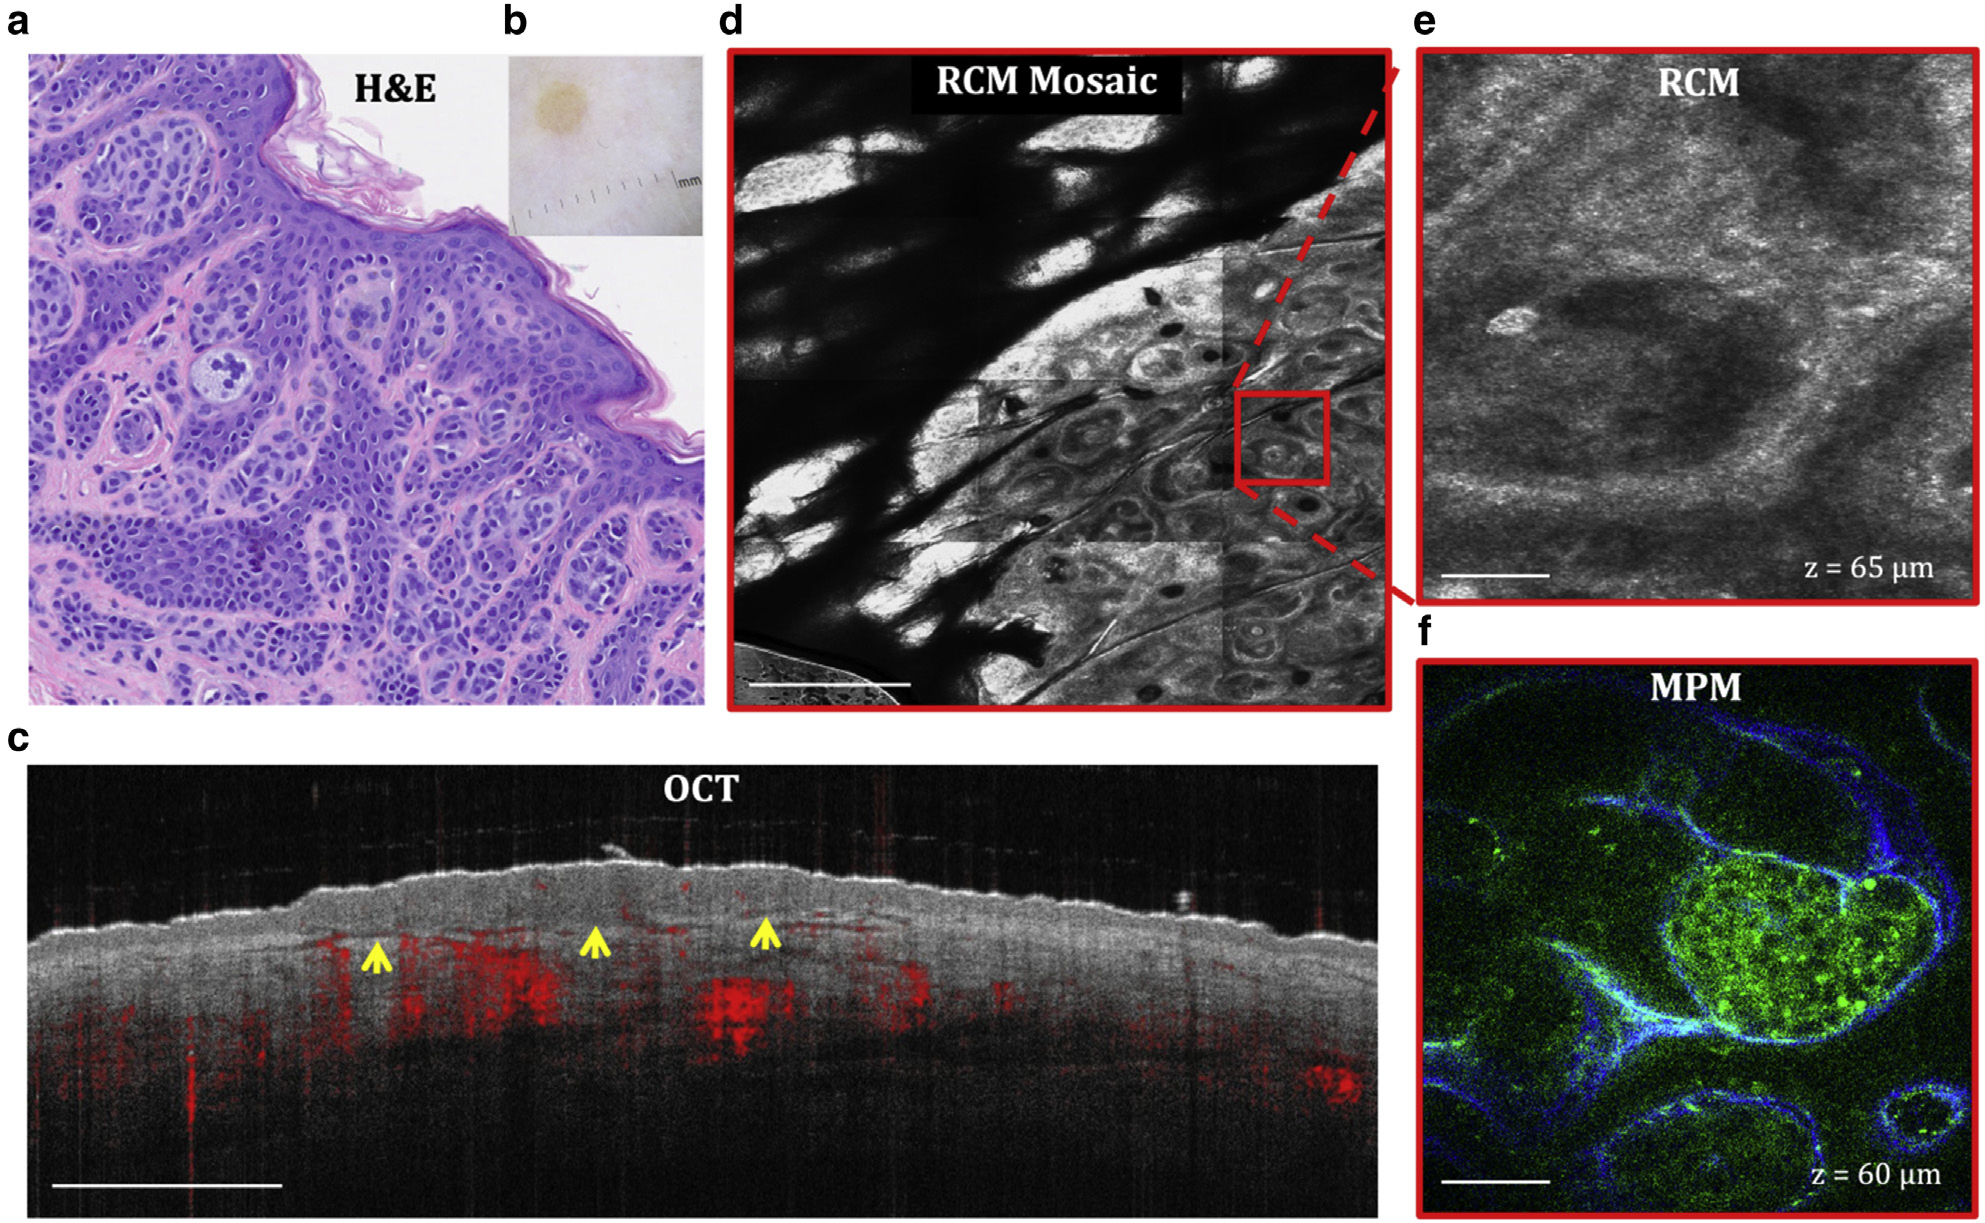
Figure 5. Dermal melanocytic nevus.

(a) H&E and (b) clinical images of the lesion. (c) Cross-sectional OCT image showing the delineation of the lesion depth (arrows). Bar = 1 mm. (d) Enface (horizontal) RCM mosaic (mm-scale) image showing the overall morphology of the lesion at a depth of 65 μm (DEJ). Bar = 500 μm. (e) Close-up view of the area outlined in the RCM image in c revealing the nests of nevus cells surrounded by fibrillar structures. Bar = 40 μm. (f) Enface MPM image acquired at the same depth showing the nests of nevus cells (green) surrounded by collagen fibers (blue). Bar = 40 μm. DEJ, dermal–epidermal junction; MPM, multiphoton microscopy; OCT, optical coherence tomography; RCM, reflectance confocal microscopy.
