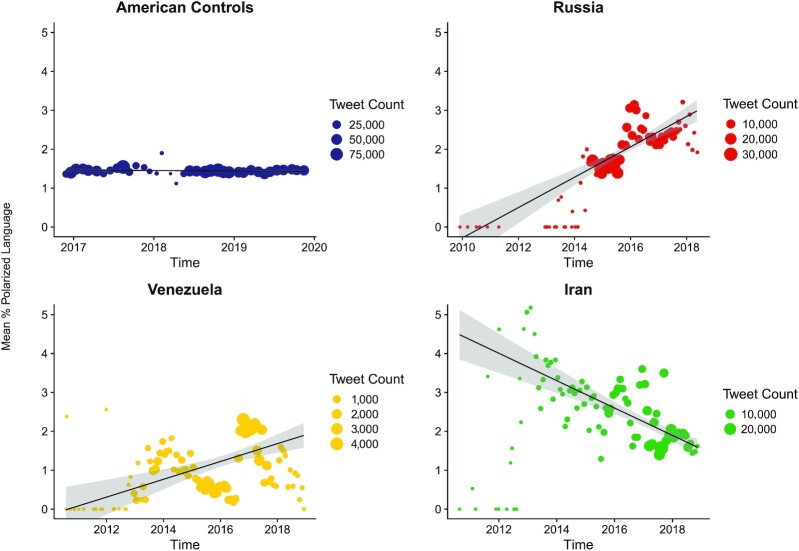
Figure 2.
Scatter plot of the average polarized score by Twitter sample. We examined monthly polarized language in American controls (N = 1,507,300; blue), and trolls from Russia (N = 383,510; red), Venezuela (N = 85,970; yellow), and Iran (N = 329,453; green). Values on the Y-axis represent the average % of polarized language in the month. The size of the dots corresponds to the monthly sample size. Shaded areas around the regression line denote 95% CI. Note that the Y-axis is fixed to 0–5, data points exceeding this limit are not shown in the figure; the regression lines take these observations into account. Results indicate that trolls from Russia and Venezuela have been increasing their use of polarized rhetoric, but Americans have not.

