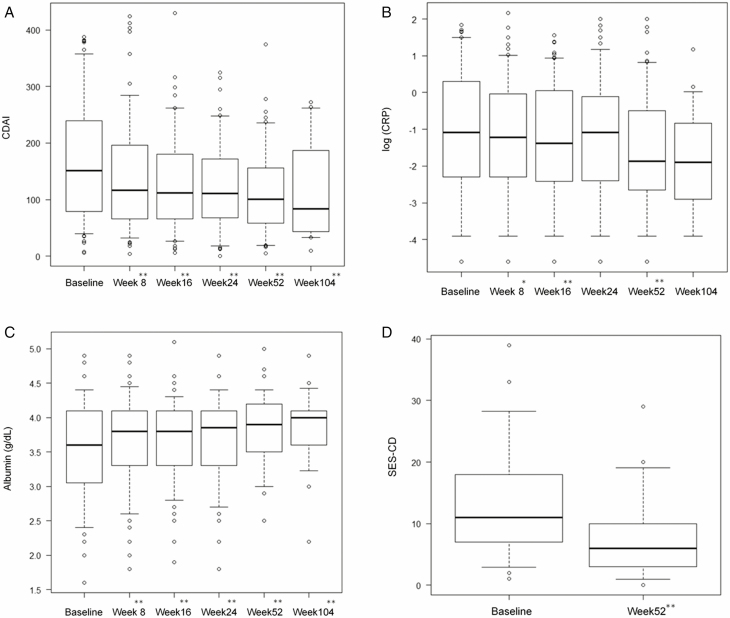
FIGURE 3.
Outcomes for (A) CDAI scores, (B) CRP levels, (C) albumin levels, and (D) SES-CD scores over time in the total cohort. The outcomes for CDAI scores, CRP levels, albumin levels, and SES-CD scores over time in the cohort of treated patients. Box and whisker plots showing 5%–95% and median changes in (A) CDAI scores, (B) CRP levels, (C) albumin levels, and (D) SES-CD scores at baseline, week 8, week 16, week 24, week 52, and week 104. * and ** indicate statistically significant differences compared to baseline; P < 0.05 and P < 0.01, respectively.

