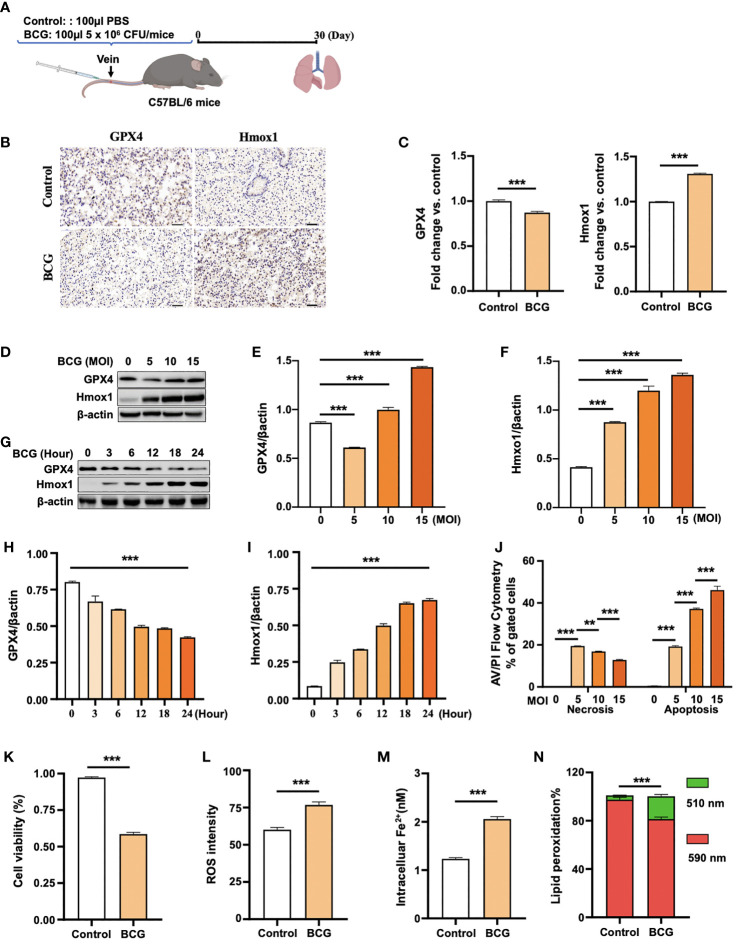
Figure 2.
BCG induces ferroptosis in macrophages. (A) Schematic diagram shows the infection of mice with BCG via tail vein injection. The infected mice are analyzed at 30 days post-infection (DPI). (B, C) C57BL/6 mice were injected with 5 × 10⁶ CFU BCG in 100 µl via the tail vein and the lungs were harvested for evaluating the expression of Gpx4 and HO-1 proteins at 30 DPI by immunohistochemical (IHC) assay (B) and semi-quantified by ImageJ-IHC Profiler (C). Lungs of mice infected with BCG showed less and more abundant Gpx4 and HO-1 proteins compared to the uninfected controls, respectively. Bar represents 500 μm in (B) (D-F) RAW264.7 murine macrophage-like cells were infected with BCG at indicated MOI for 24 h, and the abundance of Gpx4 and HO-1 proteins was examined by Western blotting assay. The representative blots (D) and semi-quantification of Gpx4 (E) and HO-1 (F) showed a dose-dependent induction of Gpx4 and HO-1 in this type of cells, except an inhibition of Gpx4 expression in cells infected with a low dose of BCG at an MOI of 5. (G–I) The representative blots (D) and semi-quantification of Gpx4 (H) and HO-1 (I) demonstrated a time-dependent inhibition of Gpx4 and induction of HO-1 in RAW264.7 infected with BCG at an MOI of 5 for a 24-h time period. (J) Induction of cell necrosis and apoptosis in RAW264.7 cells at 24 h post-infection of BCG at the indicated MOI determined by using Annexin V/PI in flow cytometry. (K) Cell viability assay showed that the infection of BCG decreased the viability of RAW264.7 cells at an MOI of 5 for 24 has detected by Trypan Blue assay. (L) The infection of BCG induced the production of intracellular ROS in RAW264.7 cells at an MOI of 5 for 24 has detected by flow cytometry assay. (M) The infection of BCG increased the concentration of intracellular Fe2+ in RAW264.7 cells at an MOI of 5 for 24 has detected using iron ion probes. (N) The infection of BCG induced lipid peroxidation in RAW264.7 cells at an MOI of 5 for 24 h as determined by BODIPY 581/591 C11 assays. Upon oxidation, its excitation of Red/590 nm shifts to 510 nm (Green). The ratio of Green/Red cells in the BCG-infected cells was 17.22%, while the uninfected cells was 3.52%. Data obtained from three independent experiments were processed using GraphPad Prism 8.0.1 software and ImageJ 1.52.a. Unpaired t-test was used to analyze the differential changes of the two groups. One-way ANOVA and Tukey’s multiple comparisons test was used to analyze the differential changes of multiple groups. Data represented mean ± SD from three independent experiments; significant differences are indicated with asterisks (**p < 0.01; ***p < 0.001).

