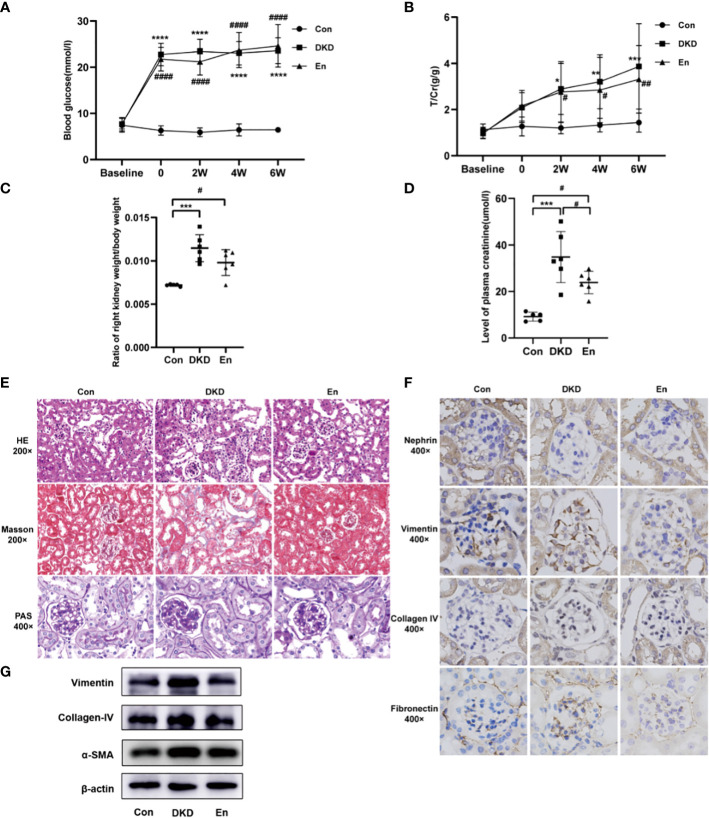
Figure 1.
Analysis of general, laboratory and pathological indexes. (A, B) Line graphs of mouse RBG and T/Cr at different time points. (C) Scatter plot of ratio of right kidney weight/body weight. (D) Scatter plot of plasma creatinine. (E) HE/Masson/PAS staining of mouse kidney tissue in each group. (F) IHC staining of nephrin, vimentin, collagen IV, fibronectin expression in kidney tissue. (G) Expression levels of vimentin, collagen IV, α-SMA in kidney tissue by Western blot analysis. *: DKD VS Con, #: En VS Con and En VS DKD. * and # p < 0.05, ** and ## p < 0.01, ***p < 0.001, **** and #### p < 0.0001.

