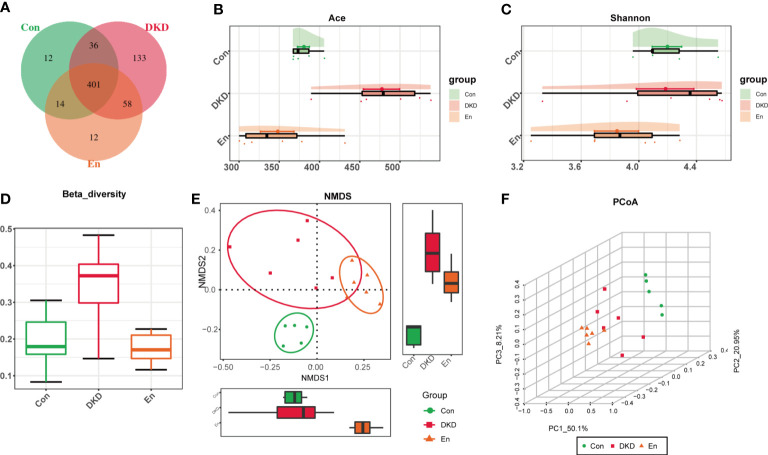
Figure 2.
Features of gut microbiota. (A) Venn diagram of OTU distribution. (B) Ace index: estimate the number of OTUs in fecal samples. (C) Cloud plot of Shannon index. (D) Box diagram of β diversity based on weighted-Unifrac distance. (E) NMDS analysis based on Bray-Curtis algorithm. (F) 3D plot of PCoA analysis based on weighted-UniFrac distance. PC1, PC2 and PC3 represent the first principal coordinate, the second principal coordinate and the third principal coordinate, respectively.

