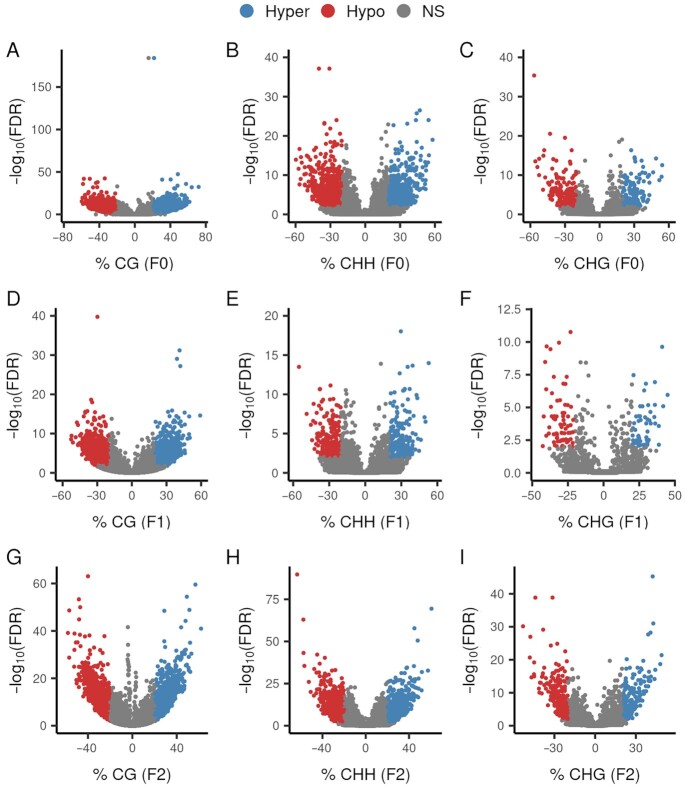
Fig. 1.
Volcano plots of DMC analyses. DMCs were defined as those with methylation difference (x-axis) greater than 20% between the treatment and control groups and with a FDR of 0.01 (y-axis) as threshold values. Red and blue dots represent DMCs hypomethylated and hypermethylated in methionine-treated group compared to control group, respectively. (A) CG context for F0. (B) CHH context for F0. (C) CHG context for F0. (D) CG context for F1. (E) CHH context for F1. (F) CHG context for F1. (G) CG context for F2. (H) CHH context for F2. (I) CHG context for F2.

